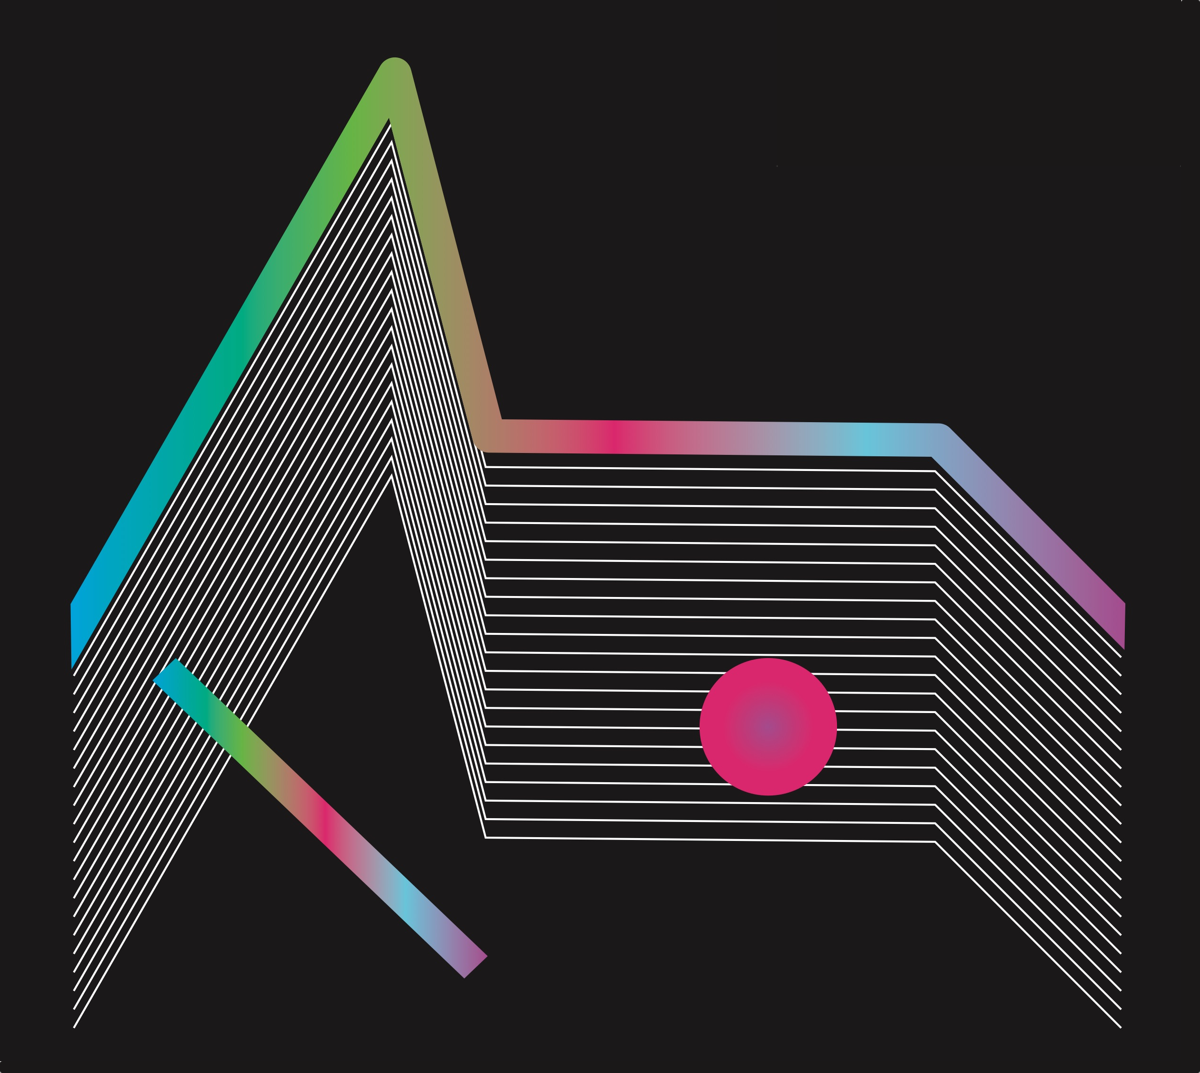
For Sustain & Decay, we invite researchers, design practitioners, and artists to investigate data for sustainable development and to think about effective and provocative ways to represent complex interdependencies within and between ecological, socio-technical, political, and urban systems, as well as other types of interfaces between dynamic systems. An example of such interdependencies is what Prof. Hausmann calls the “collective knowhow” of countries and regions. He argues that this knowhow is an important building block of the wealth of nations, and that data collection and data visualization can help to identify feasible and effective paths for economic progress, which can be used to orient the efforts of both the public and private sector. In parallel, two years ago more than 190 world leaders committed to seventeen SDGs, including eradicating extreme poverty, fighting inequality and injustice, and fixing climate change. New explorations of the use of data and visualization will play a considerable role in achieving these highly interdependent goals. In addition, we encourage submissions to focus on the myriad relationships between process and artifact. What are the creative and practical processes that are required to produce data-driven interactive artworks, visualizations, and installations? We are interested in how submitted works can influence and transform the way we understand the world around us, but also in how the design processes that go into the creation of these works can influence the way we perceive and understand them. Sustain & Decay took place in Phoenix, Arizona in October 2017, and featured work by Ozge Samanci, Adriene Jenik, Giorgia Lupi, and many others.

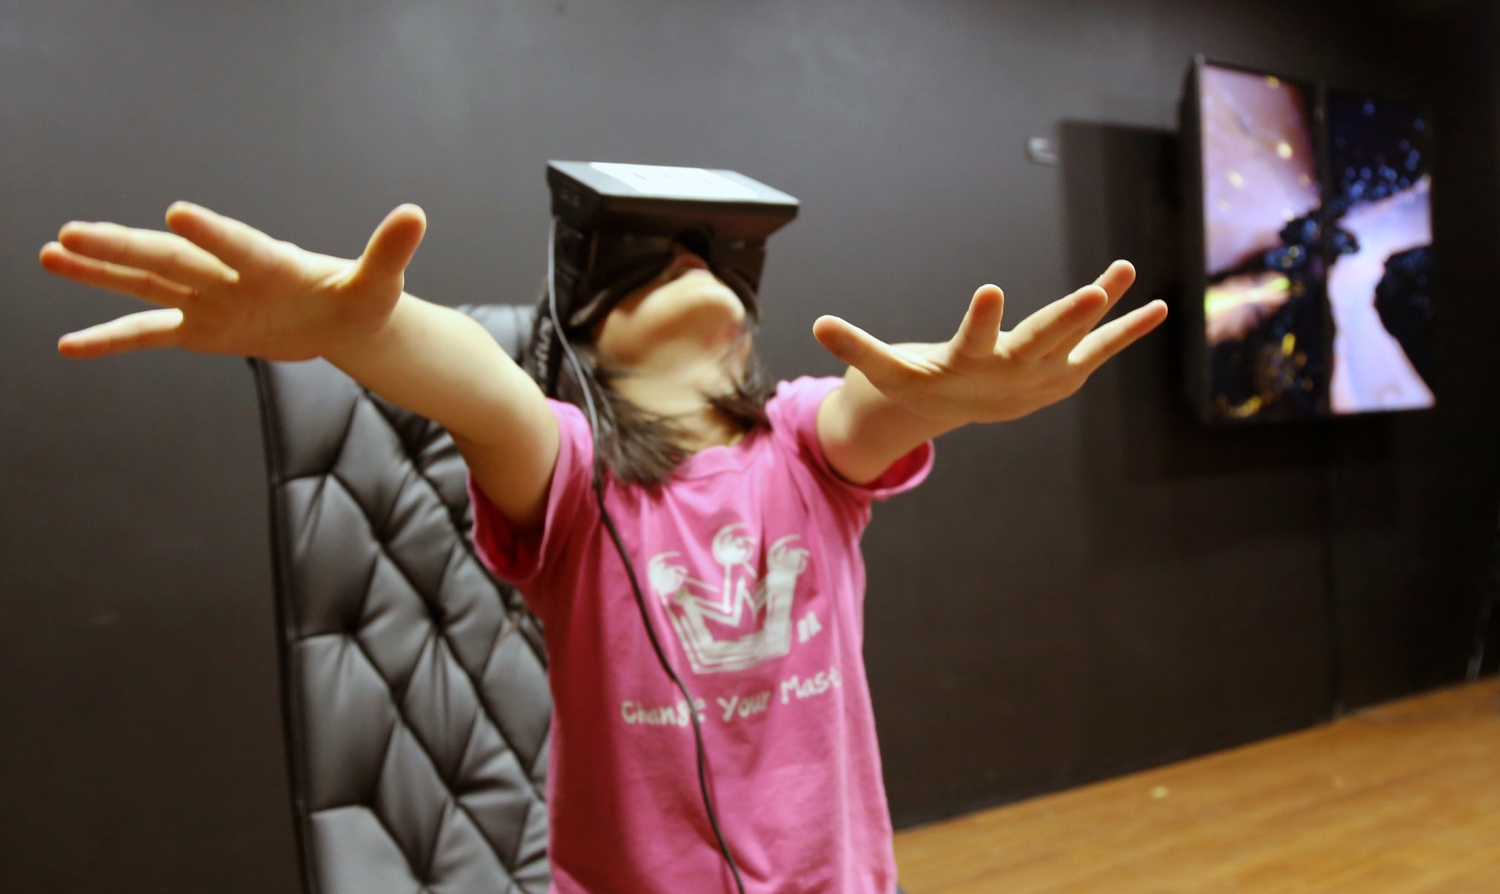
The theme for the IEEE VIS 2016 Arts Program is Metamorphoses. We encourage artists, designers, and researchers to think about transformation as a fundamental component of the pipeline from raw data to meaning. In Ovid’s epic poem— our thematic inspiration— transformations are often capricious occurrences, arising from the whim or wrath of a Greek god or goddess, yet nonetheless serve to explain the mysteries of the natural world and social order. In the realm of science, the movement from observation to hypothesis to measurement is, ideally, quantifiable and reproducible. Yet visualization researchers are also explorers, investigating new types of visual encodings and interaction techniques on ever new technologies in order to augment our understanding of the modern world. Similarly, artists often emphasize the metamorphosis of subjective experience through conceptual lenses to create artifacts that transforms our understanding of culture and technology. For this year’s Call for Entries we ask artists, designers, and researchers to question and chronicle their process of meaning making. We are especially interested in projects and papers that explore the relationships between visualization research and arts and/or design practice, and that present or discuss creative visual techniques that emphasize transformative aspects of scientific or cultural exploration. Metamorphoses took place in Baltimore in October 2016, and featured Benedikt Groß, Esteban Garcia Bravo (whose work is shown above), Yoon Chung Han, Dietmar Offenhuber, and many others.
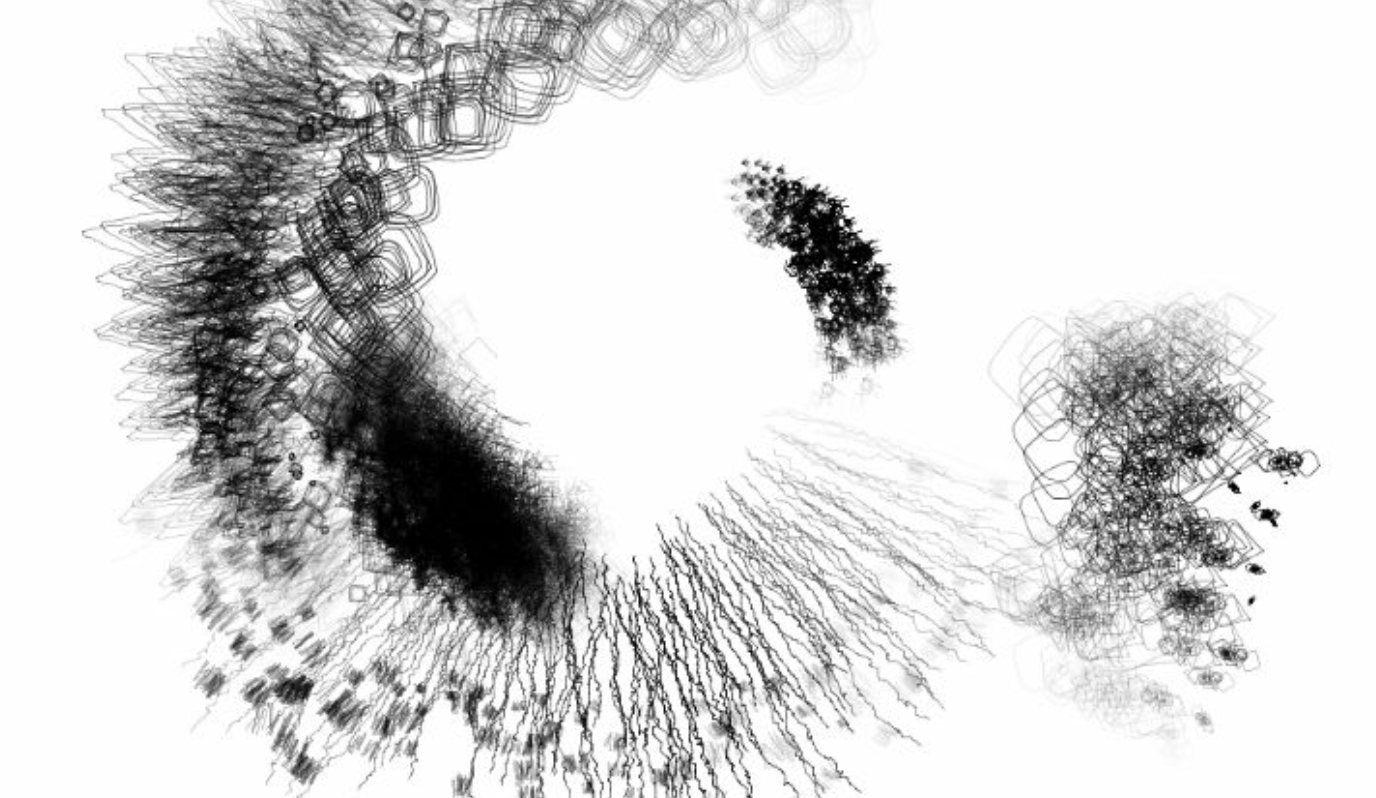
Recently, in the visualization community, significant emphasis has been placed on understanding temporality, on how to represent and reason about information that changes over time. Advances in parallel algorithms and high-performance computing hardware have made it possible to process and analyze increasing sizes of data in real-time. New visualization techniques strive to develop a means for human viewers to more effectively observe and reason about these streams of information. Computational artworks also have explored dynamics as a primary theme: how social media feeds erupt with new content, how robotic architecture can acknowledge movement or emotion, or how compositional algorithms can creatively respond to live inputs of musical sound. Moreover, there is a rich vocabulary about how meaning evolves over time that is present in other contemporary mediums: kinetic sculptures that react to natural forces or human interaction, cinematographers who capture the changing qualities of light, and jazz musicians who trade musical fragments to build new compositional ideas. Can these types of artistic explorations offer insight into thinking about the effective representation of time in visualization research contexts? Complementarily, can the advances in visualization research present new opportunities for artists to think about the creative coupling of data to meaning? Could scientific research and the arts improvise to create new spaces of interaction and analysis? In this year’s call for entries, we are looking especially for projects and papers that explore the relationships between visualization research and artistic practice, and that present or discuss creative visual techniques that emphasize the temporal and dynamic aspects of scientific or cultural exploration. Data Improvisations took place in Chicago in 2015, and featured Eduardo Kac, Dan Sandin, Donna Cox, Charlie Roberts, Graham Wakefield & Haru Ji (whose work is shown above), and many others.
In 1969, the artist Sol LeWitt published his Sentences on Conceptual Art, a series of statements that define the conceptual in contrast to the rational, and which explore differences between concepts and ideas. LeWitt, through this list of 35 sentences, describes the presentation of artworks as creating a kind of invisible conversation between artists, noting that “The words of one artist to another may induce an idea chain, if they share the same concept,” and further, that this induction is perhaps inevitable: “The process is mechanical and should not be tampered with. It should run its course.”
For Idea Chain, we invite artists to create works that reflect upon, or perhaps that challenge, the relation between the computational and the conceptual, to “run the course” of this dialogic process between the creative artists and computer scientists who will be present at Expressive 2015. This year Expressive 2015 will host an installation gallery for artworks and demonstration projects where artist installations and computational demonstrations will be featured side-by-side. Accepted artists will be invited to present their work through a panel discussion or short oral presentations within the main Expressive 2015 conference, to be held at Koç University Incubation Center on the Koç University Şişli campus in downtown Istanbul, Turkey on June 20th through June 22nd, 2015. Idea Chain featured Rebecca Xu (whose work is shown above), Emilio Vavarella, and others.
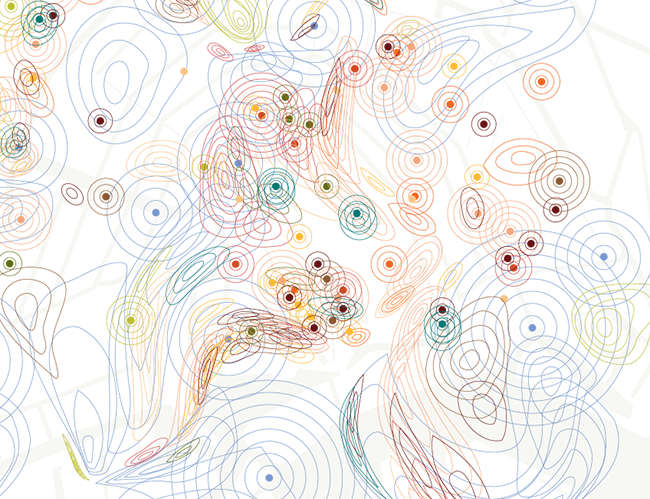
A conventional explanation of the differences between art practice and visualization research is that artistic exploration raises new questions, while visualization research aims to help domain experts answer existing questions. However, these categorizations may be oversimplified. Media artists create opportunities for reflecting on cultural issues, but also highlight how we absorb technology and explore how the exposure to tremendous amounts of data affects our daily lives. Recently, in the visualization community, significant emphasis has been placed on notions such as indicating uncertainty, accurately portraying data provenance, and using narrative techniques to aid in transmitting information more effectively. Visualization systems not only provide a representation of data collections, but also, wittingly or unwittingly, provide an interpretation of that data. Hence, potential areas of overlap between art and research practices are becoming more discernible, which raises the following key questions: Can artistic practice offer insight into thinking about the effective interpretability of complex data? Conversely, can visualization research offer quantifiable methods to artists seeking to investigate and represent cultural phenomena? VISAP’14 took place in Paris, France in 2014, featuring George Legrady, Scott Rettberg & Robert Coover & Daria Tsoupikova, Kate McClean (whose work is shown above), Shannon McMullen & Fabian Winker, Till Nagel, and many others.

Visualization research encompasses not only data representation,
but also the development of interaction techniques, explorations of display aesthetics,
and examinations of applied perception. Increasingly, empirical justification for new
visualization techniques is derived through well-designed experiments. And in fact,
much recent research is concerned with the creation, implementation, replication,
and evaluation of user studies in order to propel the fields of information and scientific
visualization. At the same time, the new media arts community is interested in the creative
possibilities offered by new technologies and new techniques, but also in developing new methods
and presentations to explore and question their cultural meaning and impact. What does it mean
for an art installation to produce experimental results? Could an artwork be expressive,
challenging, and conceptual, yet simultaneously rigorous, practical, and empirical? We invite
artists and researchers to think about the connections and chasms between art and research, and to
explore the nature of experimental design and creative experimentation. VISAP’13 took place in
Atlanta, and featured Hilary Harp & Barry Moon, kEiTH Soo, Yeohyun Ahn,
Philip Galanter (whose work is shown above), and many others.