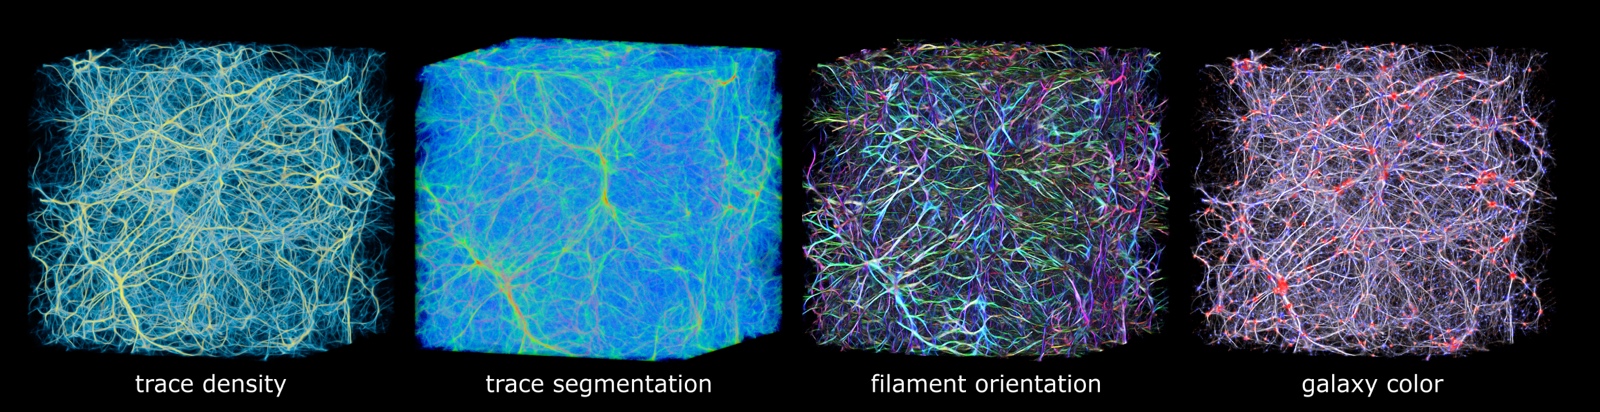
Polyphorm is an interactive visualization and model fitting tool that provides a novel approach
for investigating cosmological datasets. Through a fast computational simulation method inspired by the behavior of Physarum
polycephalum, an unicellular slime mold organism that efficiently forages for nutrients, astrophysicists are able to extrapolate from
sparse datasets, such as galaxy maps archived in the Sloan Digital Sky Survey, and then use these extrapolations to inform analyses of
a wide range of other data, such as spectroscopic observations captured by the Hubble Space Telescope. Researchers can interactively
update the simulation by adjusting model parameters, and then investigate the resulting visual output to form hypotheses about the
data. Polyphorm was been presented at IEEE VIS’20,
and ALife’20, and was a core component of our winning entry for
the IEEE VisAstro data challenge. More information about Polyphorm and the Monte Carlo Physarum Machine can be found on at the Polyphorm code repo, including instructions for running the software and video documentation. Polyphorm was developed in collaboration with Jason X. Prochaska (UCSC) and Joseph N. Burchett (NMSU).
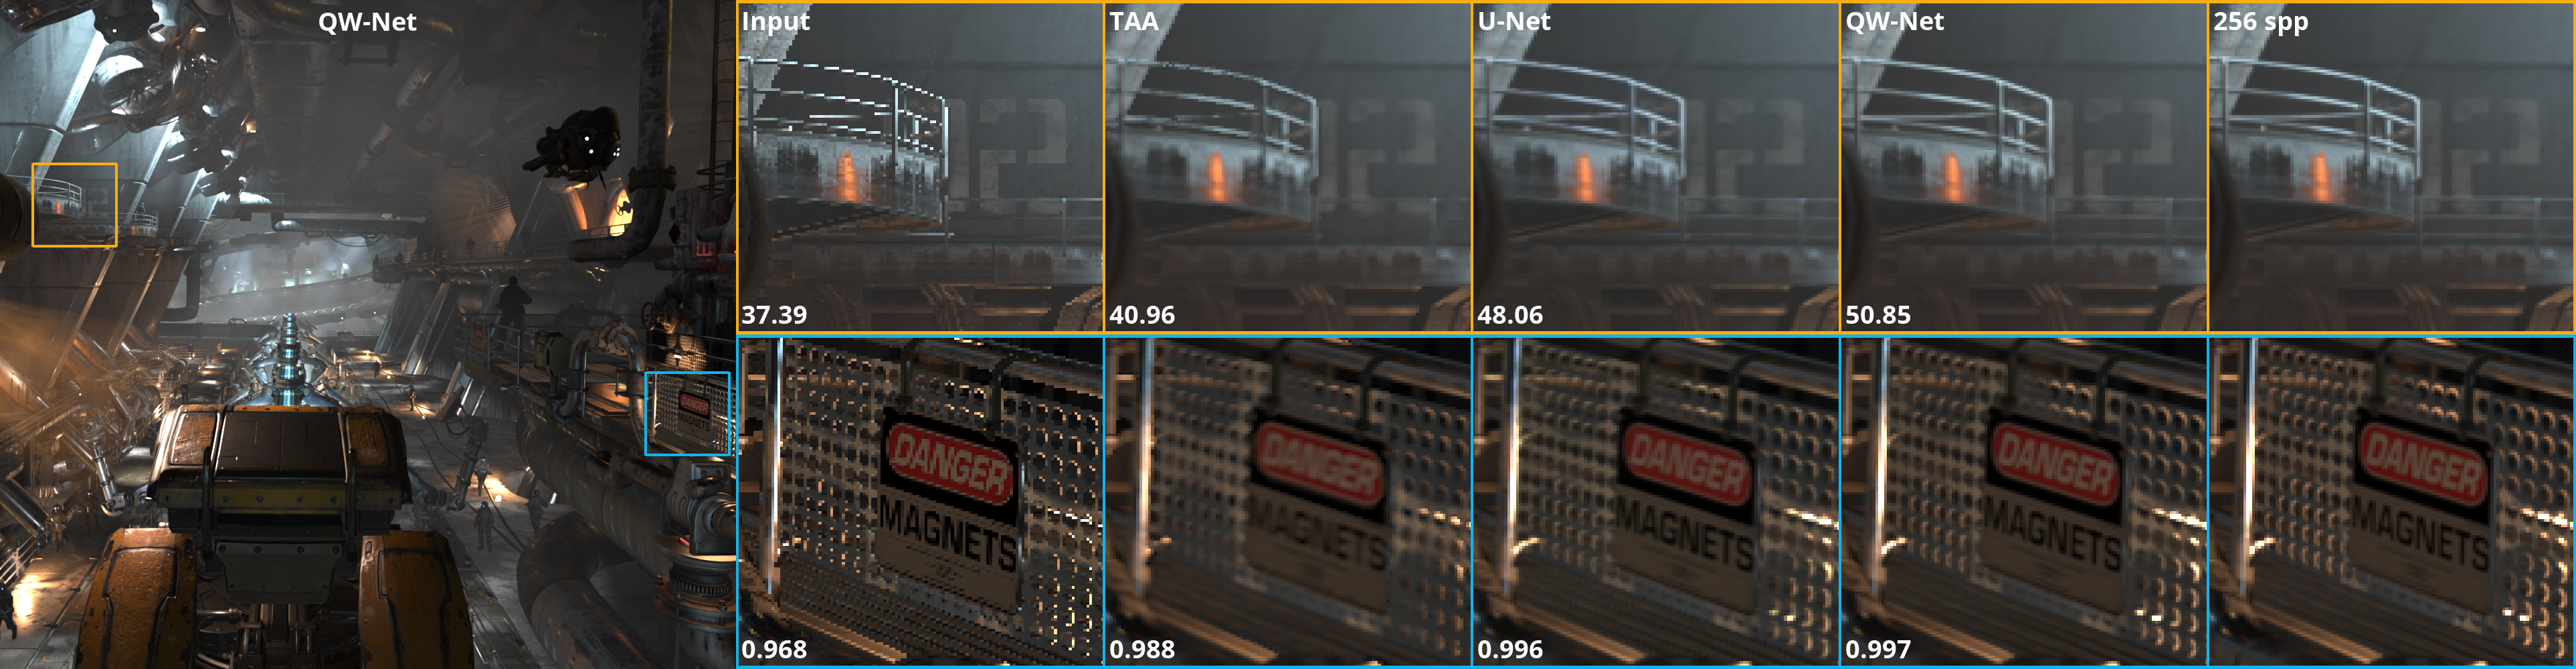
Neural networks are often quantized to use reduced-precision arithmetic, as it greatly improves their storage and computational costs. This approach is commonly used in applications like image classification and natural language processing, however, using a quantized network for the reconstruction of HDR images can lead to a significant loss in image quality. In this paper, we introduce QW-Net, a neural network for image reconstruction, where close to 95% of the computations can be implemented with 4-bit integers. This is achieved using a combination of two U-shaped networks that are specialized for different tasks, a feature extraction network based on the U-Net architecture, coupled to a filtering network that reconstructs the output image. The feature extraction network has more computational complexity but is more resilient to quantization errors. The filtering network, on the other hand, has significantly fewer computations but requires higher precision. Our network uses renderer-generated motion vectors to recurrently warp and accumulate previous frames, producing temporally stable results with significantly better quality than TAA, a widely used technique in current games. An article describing QW-Net, titled A Reduced-Precision Network for Image Reconstruction, is accepted to ACM SIGGRAPH Asia, to be published in ACM Transactions on Graphics.
Art students undertake years of life drawing to learn how to capture human likenesses in graphite and clay. Yet videogames which allow players to create their own character must somehow facilitate avatar creation by novice users. We describe creativity support tools for digital portraiture in terms of their design spaces, which conveniently possess both a high-dimensional linear space of representations, and a highly expressive nonlinear space of referents. Using the casual creators tropes of parameterization and paper dolls, we investigate how distinct ‘face spaces’ are made playable by these tools and toys. We consider in depth The Sims 3’s Create-A-Sim mode, a 3D avatar creator whose expressive range is further expanded by a modding community through intentional and highly technical interventions. Finally, we connect these skills to practices using professional creativity support tools for digital portraiture. We argue that the skillful practice of creating beautiful and evocative avatars is encoded simultaneously in software tools and in artistic communities, enabling a form of conversation between the portrait artist and their medium. This investigation, titled Entering the design space of digital portraiture:
A case study in avatar creation tools, was presented by Jasmine Otto on September 8th at the Casual Creators Workshop during the International Conference on Computational Creativity.
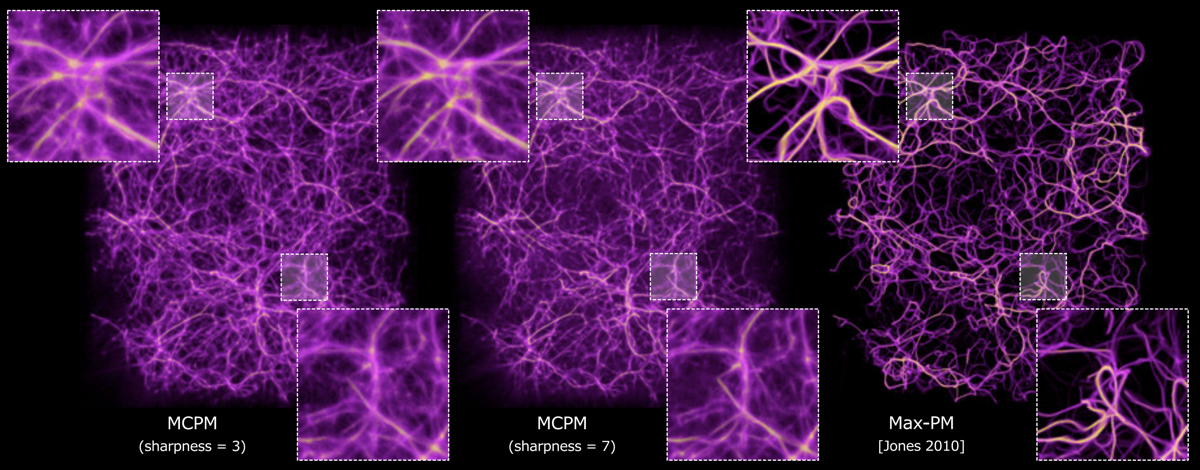
Modern cosmology predicts that matter in our Universe has assembled today into a vast network of filamentary structures colloquially termed the Cosmic Web. Because this matter is either electromagnetically invisible (i.e., dark) or too diffuse to image in emission, tests of this cosmic web paradigm are limited. Widefield surveys do reveal web-like structures in the galaxy distribution, but these luminous galaxies represent less than 10% of baryonic matter. Statistics of absorption by the intergalactic medium (IGM) via spectroscopy of distant quasars support the model yet have not conclusively tied the diffuse IGM to the web. Here, we report on a new method inspired by the Physarum polycephalum slime mold that is able to infer the density field of the Cosmic Web from galaxy surveys. Applying our technique to galaxy and absorption-line surveys of the local Universe, we demonstrate that the bulk of the IGM indeed resides in the Cosmic Web. This research was led by Joseph N. Burchett (UCSC Astronomy and Astrophysics) and Oskar Elek (UCSC Creative Coding) and has been featured on both NASA’s and ESA‘s homepages, and an overview of the project with an accompanying video was released by the UCSC News Center.
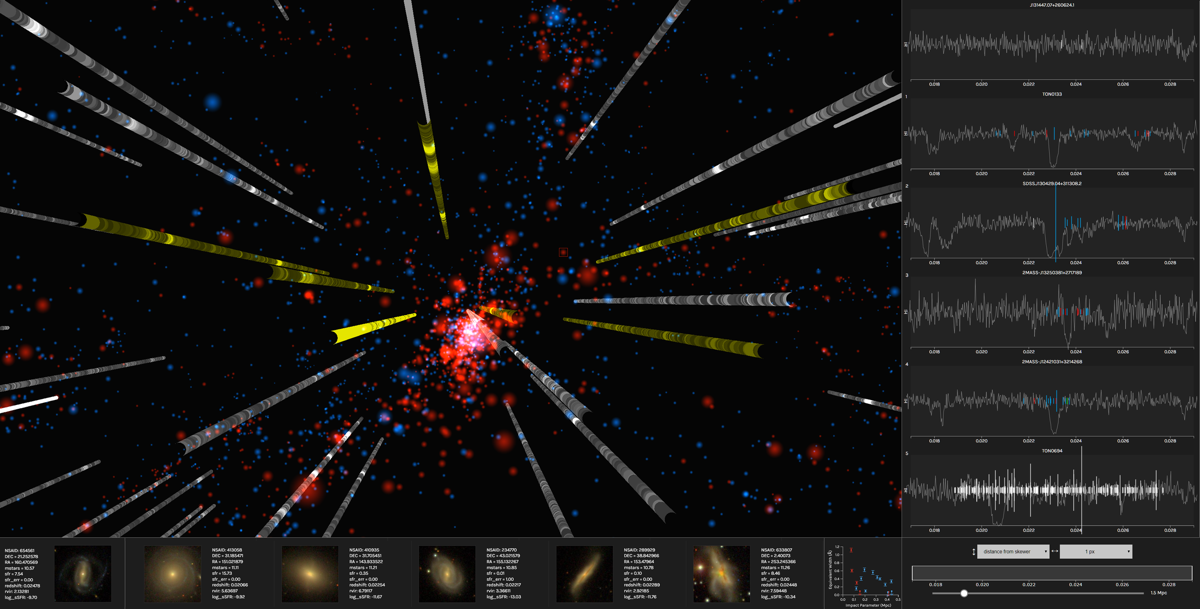
Using techniques to measure light across a wide range of the
electromagnetic spectrum, including radio, optical, ultraviolet, and X-rays,
astrophysicists study the life cycle and evolution of galaxies. Many answers to questions
about the life cycle of galaxies lie in the vast gaseous envelopes surrounding the brilliant
spirals and spheroids composed of stars, and can be investigated through a clearer understanding
of the composition and physical state of these gaseous envelopes (or circumgalactic medium, CGM).
The Intergalactic Medium Visualization, or IGM-Vis, presents data gathered via Hubble Space Telescope measurements
in order to facilitate the analysis of IGM and CGM data. It was developed by researchers from UCSC Creative Coding
in collaboration with astrophysicists from UCSC’s Astronomy & Astrophysics
Department. An article describing the project— authored by Joseph N. Burchett, David Abramov, Jasmine Otto, Cassia Artanegara, J. Xavier Prochaska, and Angus Forbes—
was accepted to EuroVis’19 and published in Computer Graphics Forum.
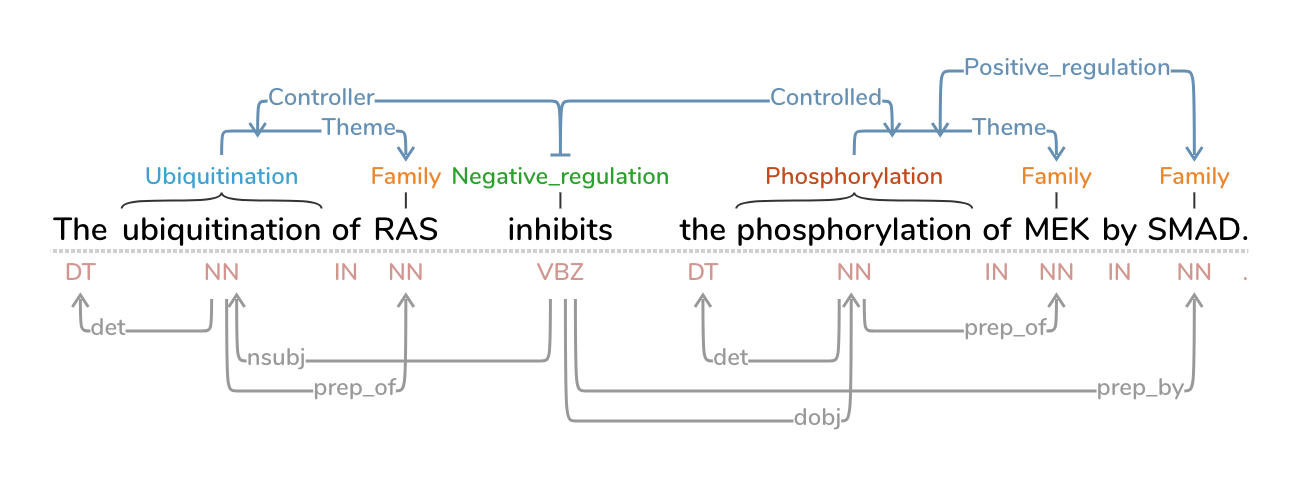
Text Annotation Graphs, or TAG, provides functionality for representing complex relationships between words and word phrases, including the ability to define and visualize relationships between the relationships themselves (semantic hypergraphs). Additionally, we include an approach to representing text annotations in which annotation subgraphs, or semantic summaries, are used to show relationships outside of the sequential context of the text itself. Users can utilize these subgraphs to quickly find similar structures within the current document or external annotated documents. TAG was developed to support information extraction tasks on a large database of biomedical articles. However, our software is flexible enough to support a wide range of annotation tasks for any domain. TAG was developed by Angus Forbes and Kristine Lee in collaboration with the Computational Language Understanding Lab (CLU Lab) at University of Arizona.
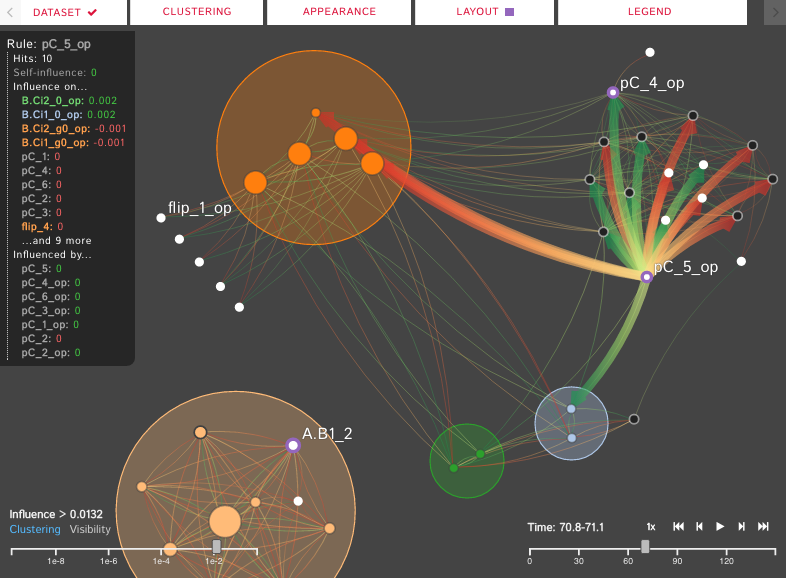
Force-directed techniques are used to automatically generate interactive visualizations of node-link relationships. However, there are numerous issues when using them to represent large networks, such as scaling, visual clutter and abstracting meaningful information. In this project, we apply force-directed networks to a biological system and explore various techniques that can be used to help alleviate the issues faced in larger force-directed networks. The Kappa Simulator (KaSim), developed by Walter Fontana, is a rule-based language and stochastic simulator used for simulating protein interaction networks. Our visualization tool, DIN-Viz, developed by EVL students Kristine Lee, Xing Li, and Andrew Burks (in collaboration with Fontana’s research group at Harvard Medical School), represents the results of these simulations in order to help scientists better understand the stochastic biological systems they are modeling. Source code can be found at the UCSC Creative Coding code repository.
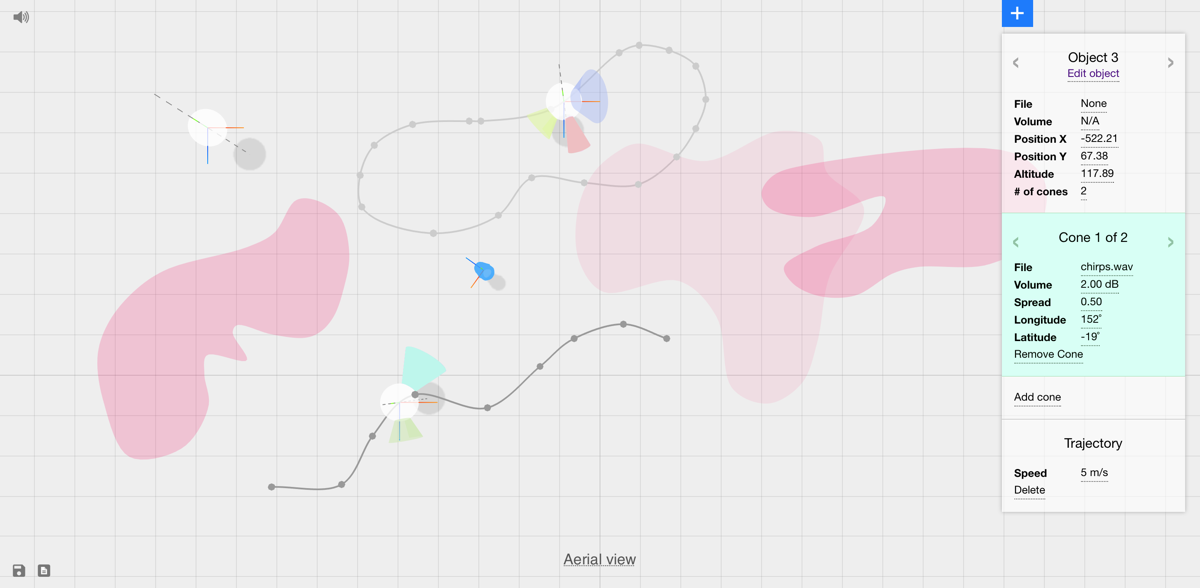
Current authoring interfaces for processing audio in 3D environments are limited by a lack of specialized tools for 3D audio, separate editing and rendering modes, and platform-dependency. To address these limitations, we introduce INVISO, a novel web-based user interface that makes it possible to control the binaural or Ambisonic projection of a dynamic 3D auditory scene. Specifically, our interface enables a highly detailed bottom-up construction of virtual sonic environments by offering tools to populate navigable sound fields at various scales (i.e. from sound cones to 3D sound objects to sound zones). Using modern web technologies, such as WebGL and Web Audio, and adopting responsive design principles, we developed a cross-platform UI that can operate on both personal computers and tablets. This enables our system to be used for a variety of mixed reality applications, including those where users can simultaneously manipulate and experience 3D sonic environments. INVISO was developed by Anıl Çamcı in collaboration with Kristine Lee, Cody Roberts, and Angus Forbes, and was presented most recently at UIST’17.
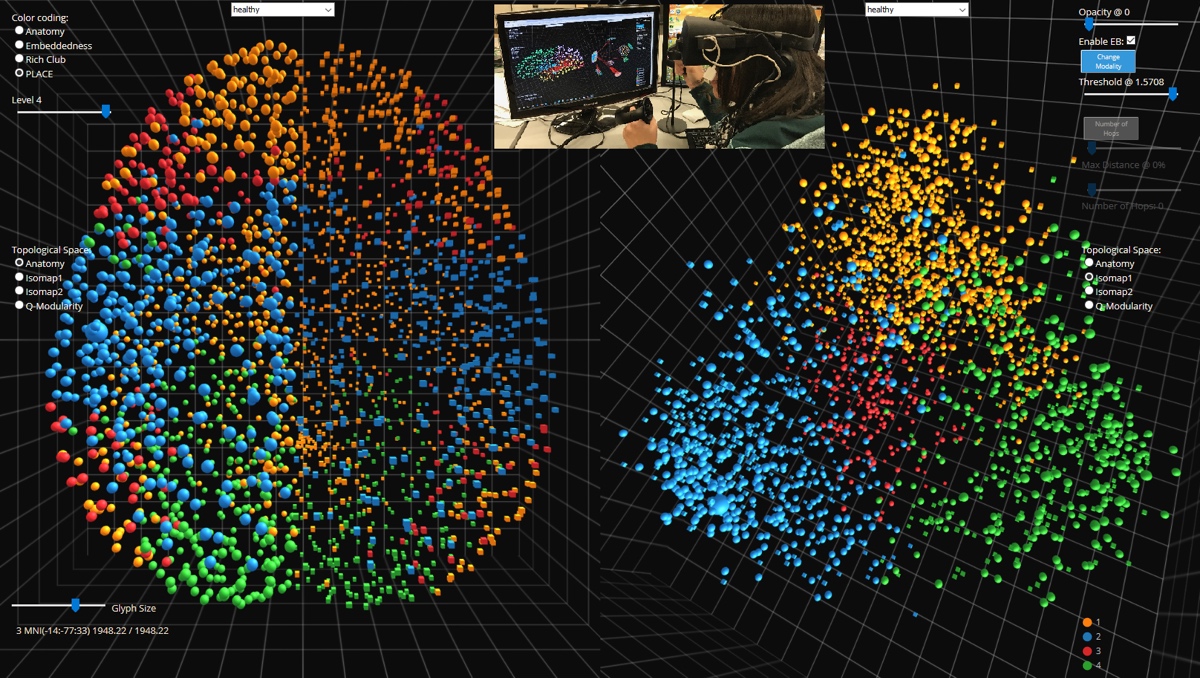
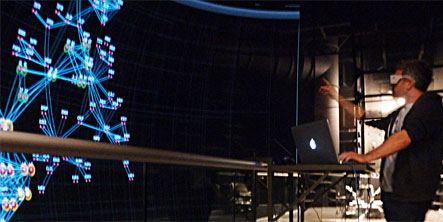
NeuroCave is a novel immersive analytics system that facilitates the visual inspection of structural and functional connectome datasets. The representation of the human connectome as a graph enables neuroscientists to apply network-theoretic approaches in order to explore its complex characteristics. With NeuroCave, brain researchers can interact with the connectome— either in a standard desktop environment or while wearing portable VR headsets (such as Oculus Rift, Samsung Gear, or Google Daydream VR platforms)— in any co-ordinate system or topological space, as well as cluster brain regions into different modules on demand. Furthermore, a default side-by-side layout enables simultaneous, synchronized manipulation in 3D, utilizing modern GPU hardware architecture, and facilitates comparison tasks across different subjects or diagnostic groups or longitudinally within the same subject. Visual clutter is mitigated using a state-of-the-art edge bundling technique and through an interactive layout strategy, while modular structure is optimally positioned in 3D exploiting mathematical properties of platonic solids. NeuroCave provides new functionality to support a range of analysis tasks not available in other visualization software platforms. NeuroCave was developed in collaboration with the Collaborative Neuroimaging Environment for Connectomics (CoNECt@UIC), and first presented at NetSci 2017, the International School and Conference on Network Science.
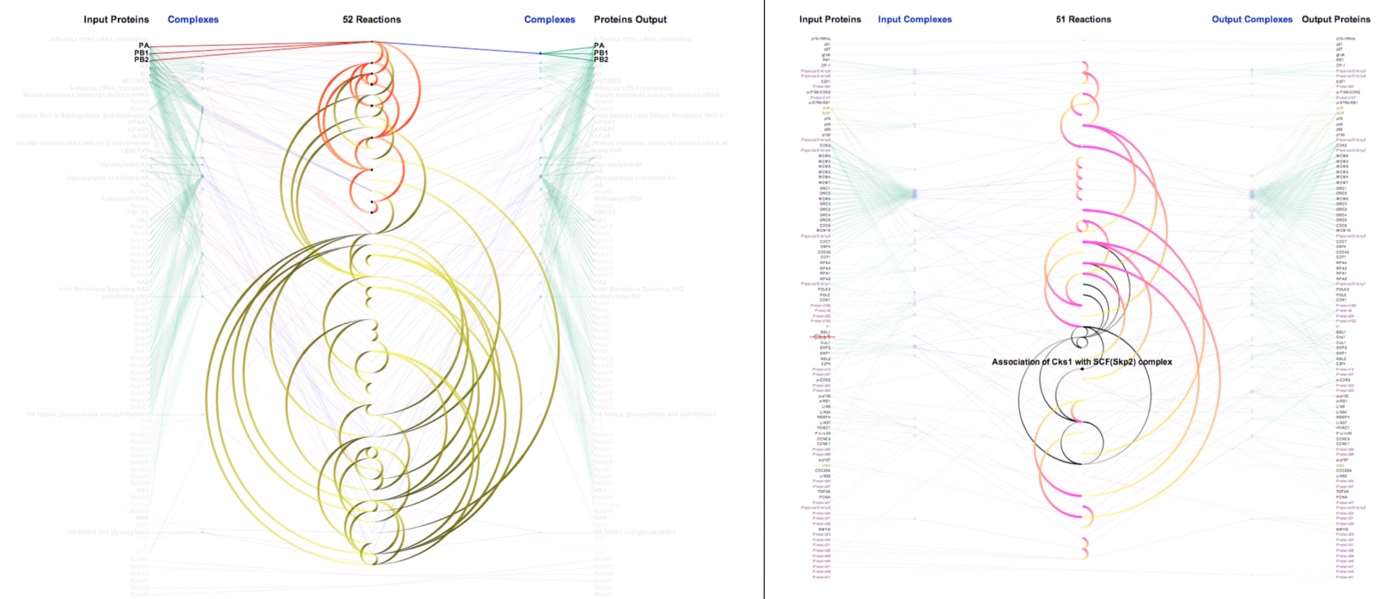
Understanding the causality inherent in networks of biological pathways is an active area of research for systems biologists, cancer researchers, and drug designers. ReactionFlow explores the use of animation within novel network visualizations of biological pathways to enable a number of tasks related to representing and analyzing causality, including: finding components that are downstream and/or upstream from a particular protein or biochemical reaction; finding the shortest path between two proteins in a network or subnetwork; identifying feedback loops within a pathway; and simluating the effect of perturbing the network by “knocking out” a protein or protein complex. This technique, developed by Tuan Dang in collaboration with Paul Murray, Jillian Aurisano, and Angus Forbes, was presented at BioVis’15. Source code can be found at the Creative Coding Research Group’s code repository.
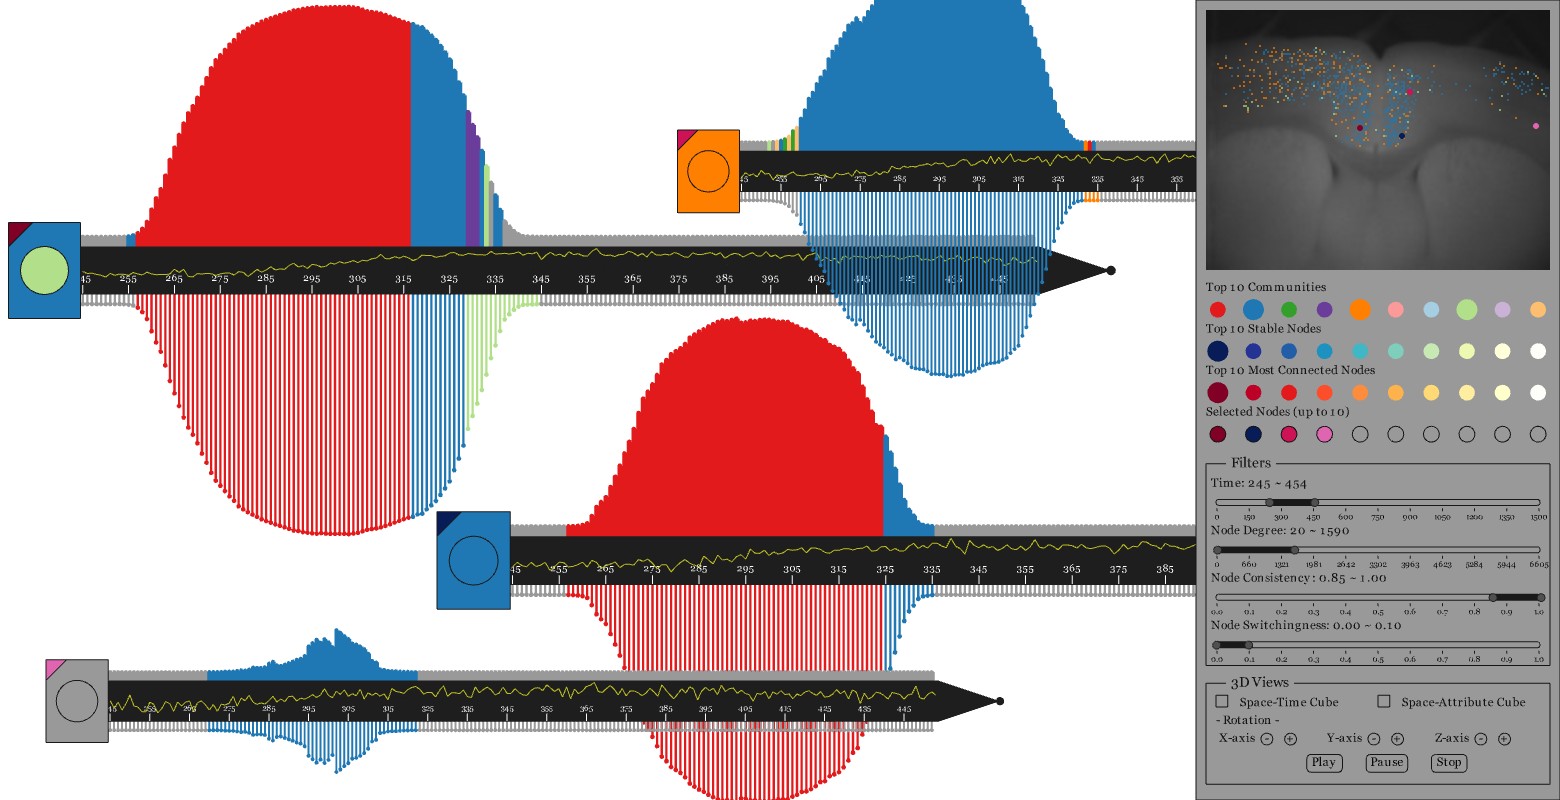
Studying the behavior of individual members in communities of dynamic networks can help neuroscientists understand how interactions between neurons in brain networks change over time. Visualizing those temporal features is challenging, especially for networks embedded within spatial structures, such as brain networks.
Two projects led by Chihua Ma, Animated dual-representation and SwordPlots, provide visual analytics tools to better understand how the functional behavior of the brain changes over time, how such behaviors are related to the spatial structure of the brain, and how communities of neurons with similar functionality evolve over time.
The first project was presented at EuroVis’15 and incorporates interactive animated dual-representation of the connectivity between brain regions as it changes over time. The enhanced node-link diagram and distance matrix visualizations are coordinated, each serving as interfaces for each other to better enable visual analytics tasks using dynamic brain network data. The second project was recently accepted for publication in the Journal of Imaging Science and Technology; it provides a novel interactive multi-view visualization system to assist neuroscientists in their exploration of dynamic brain networks from multiple perspectives. These projects are collaborations with the computer scientists Tanya Berger-Wolf, Robert Kenyon, and Angus Forbes of UIC, and the neuroscientist Daniel Llano of UIUC.
Stereoscopic highlighting, developed in collaboration with Basak Alper, Tobias Höllerer, and JoAnn Kuchera-Morin, is a novel technique that helps to
answer accessibility and adjacency queries when interacting with a node-link diagram. The technique utilizes stereoscopic depth to
highlight regions of interest in a 2D graph by projecting these parts onto a plane closer to the viewpoint of the user. This technique
aims to isolate and magnify specific portions of the graph that need to be explored in detail without resorting to other highlighting
techniques, such as color or motion, which can then be reserved to encode other data attributes. This mechanism of stereoscopic
highlighting also enables focus+context views by juxtaposing a detailed image of a region of interest with the overall graph, which is
visualized at a further depth with correspondingly less detail. The stereoscopic highlighting technique was presented at InfoVis’11 and later published in IEEE Transactions on Visualization and Computer Graphics.
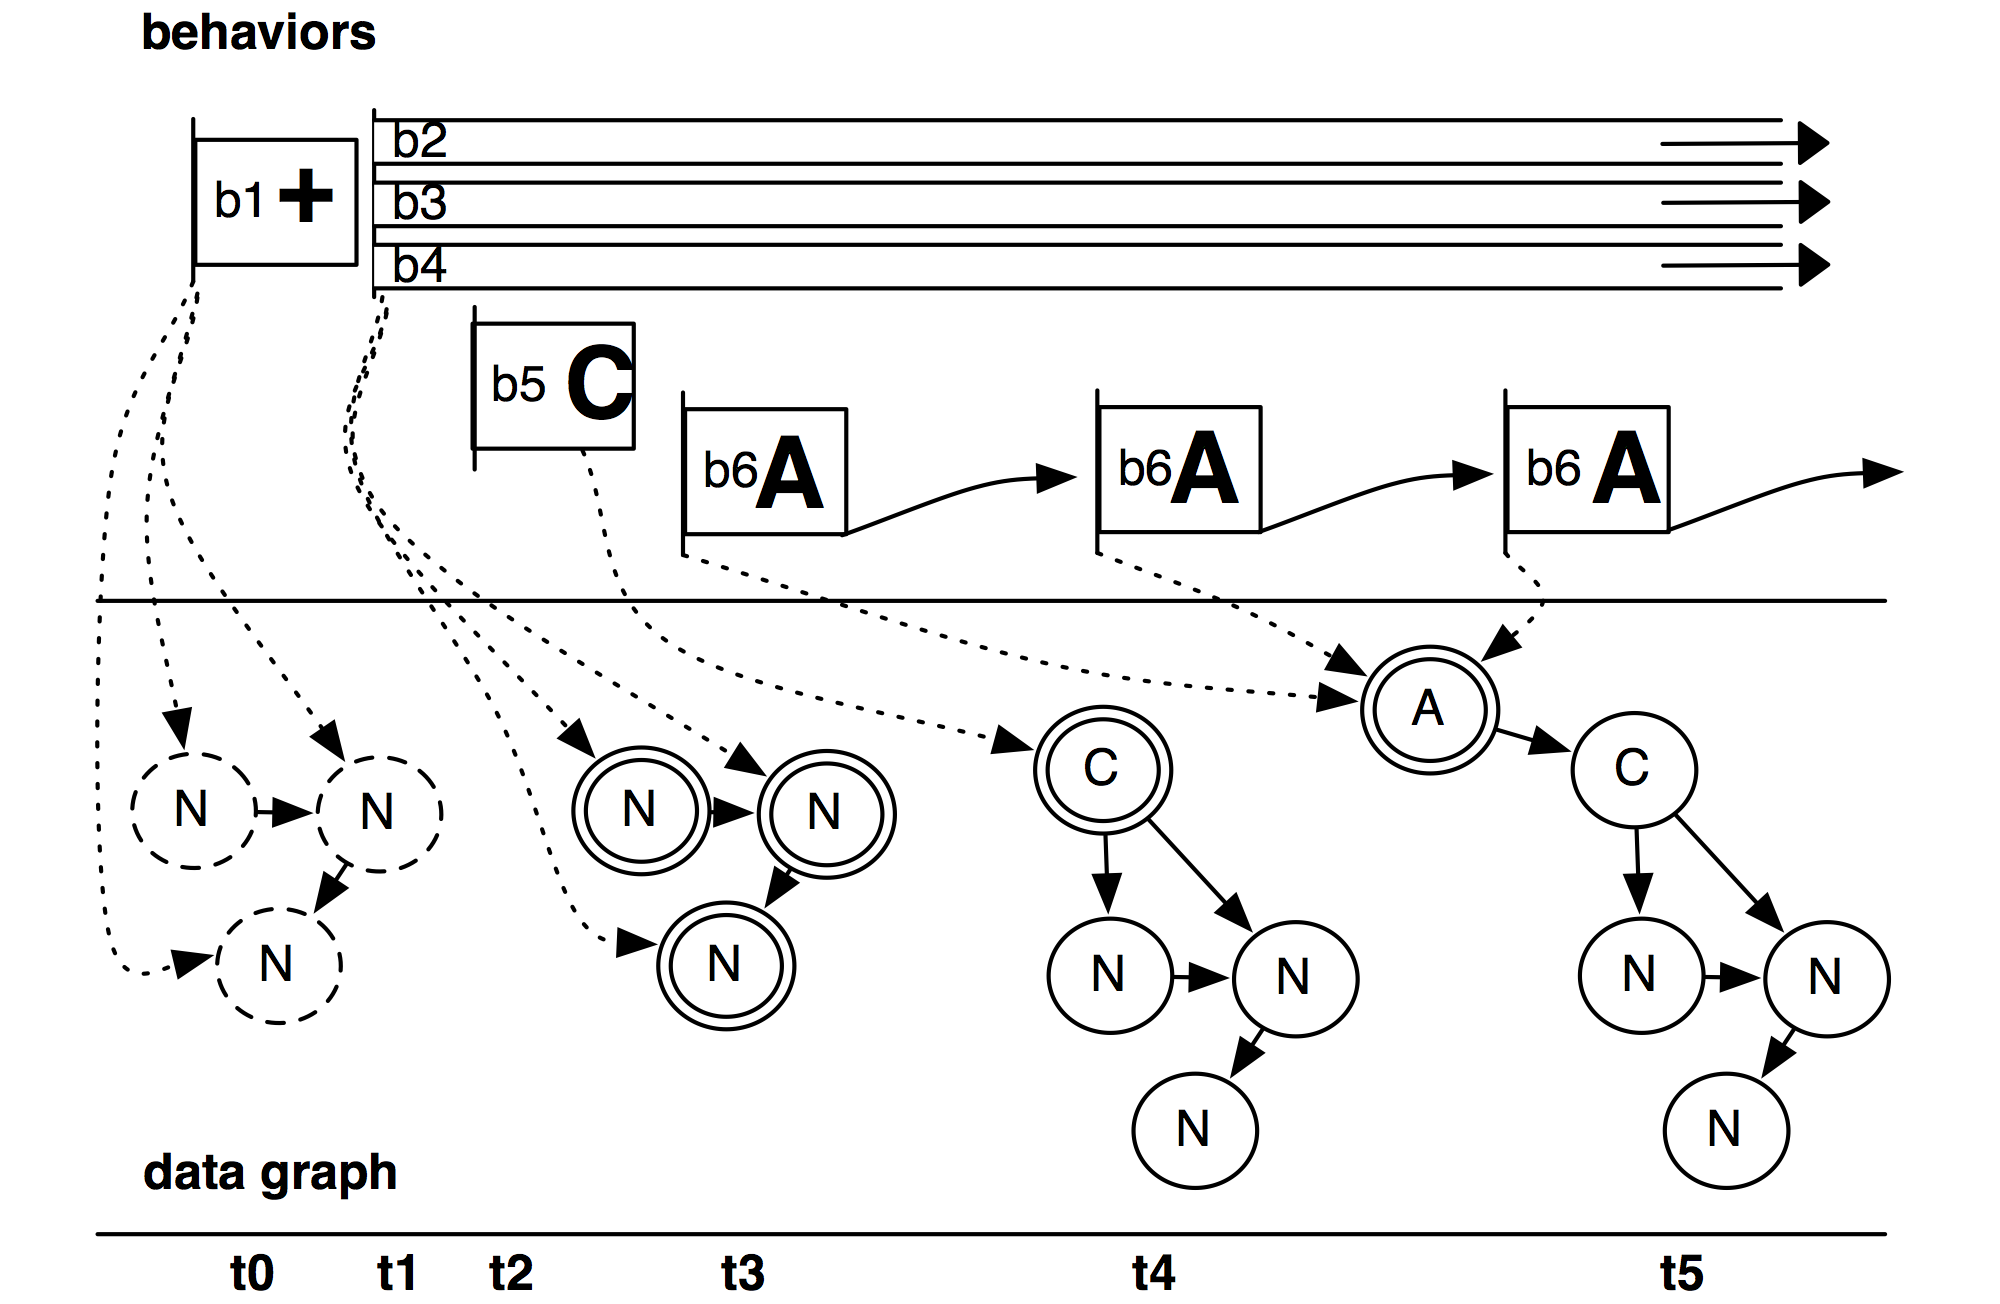
Behaviorism is a software framework that faciliates the creation of new visualizations. It allows a wide range of flexibility when working with dynamic information on visual, temporal, and ontological levels, but at the same time provides appropriate abstractions that allow developers to create prototypes quickly, which can then easily be turned into robust systems. The core of the framework is a set of three interconnected graphs, each with associated operators: a scene graph for high-performance 3D rendering, a data graph for different layers of semantically-linked heterogeneous data, and a timing graph for sophisticated control of scheduling, interaction, and animation. In particular, the timing graph provides a unified system to add behaviors to both data and visual elements, as well as to the behaviors themselves. Behaviorism has been used to create a wide range of visualization and media arts projects. It was presented at InfoVis’10 and later published in the IEEE Transactions on Visualization and Computer Graphics.
Additional projects can be found here.