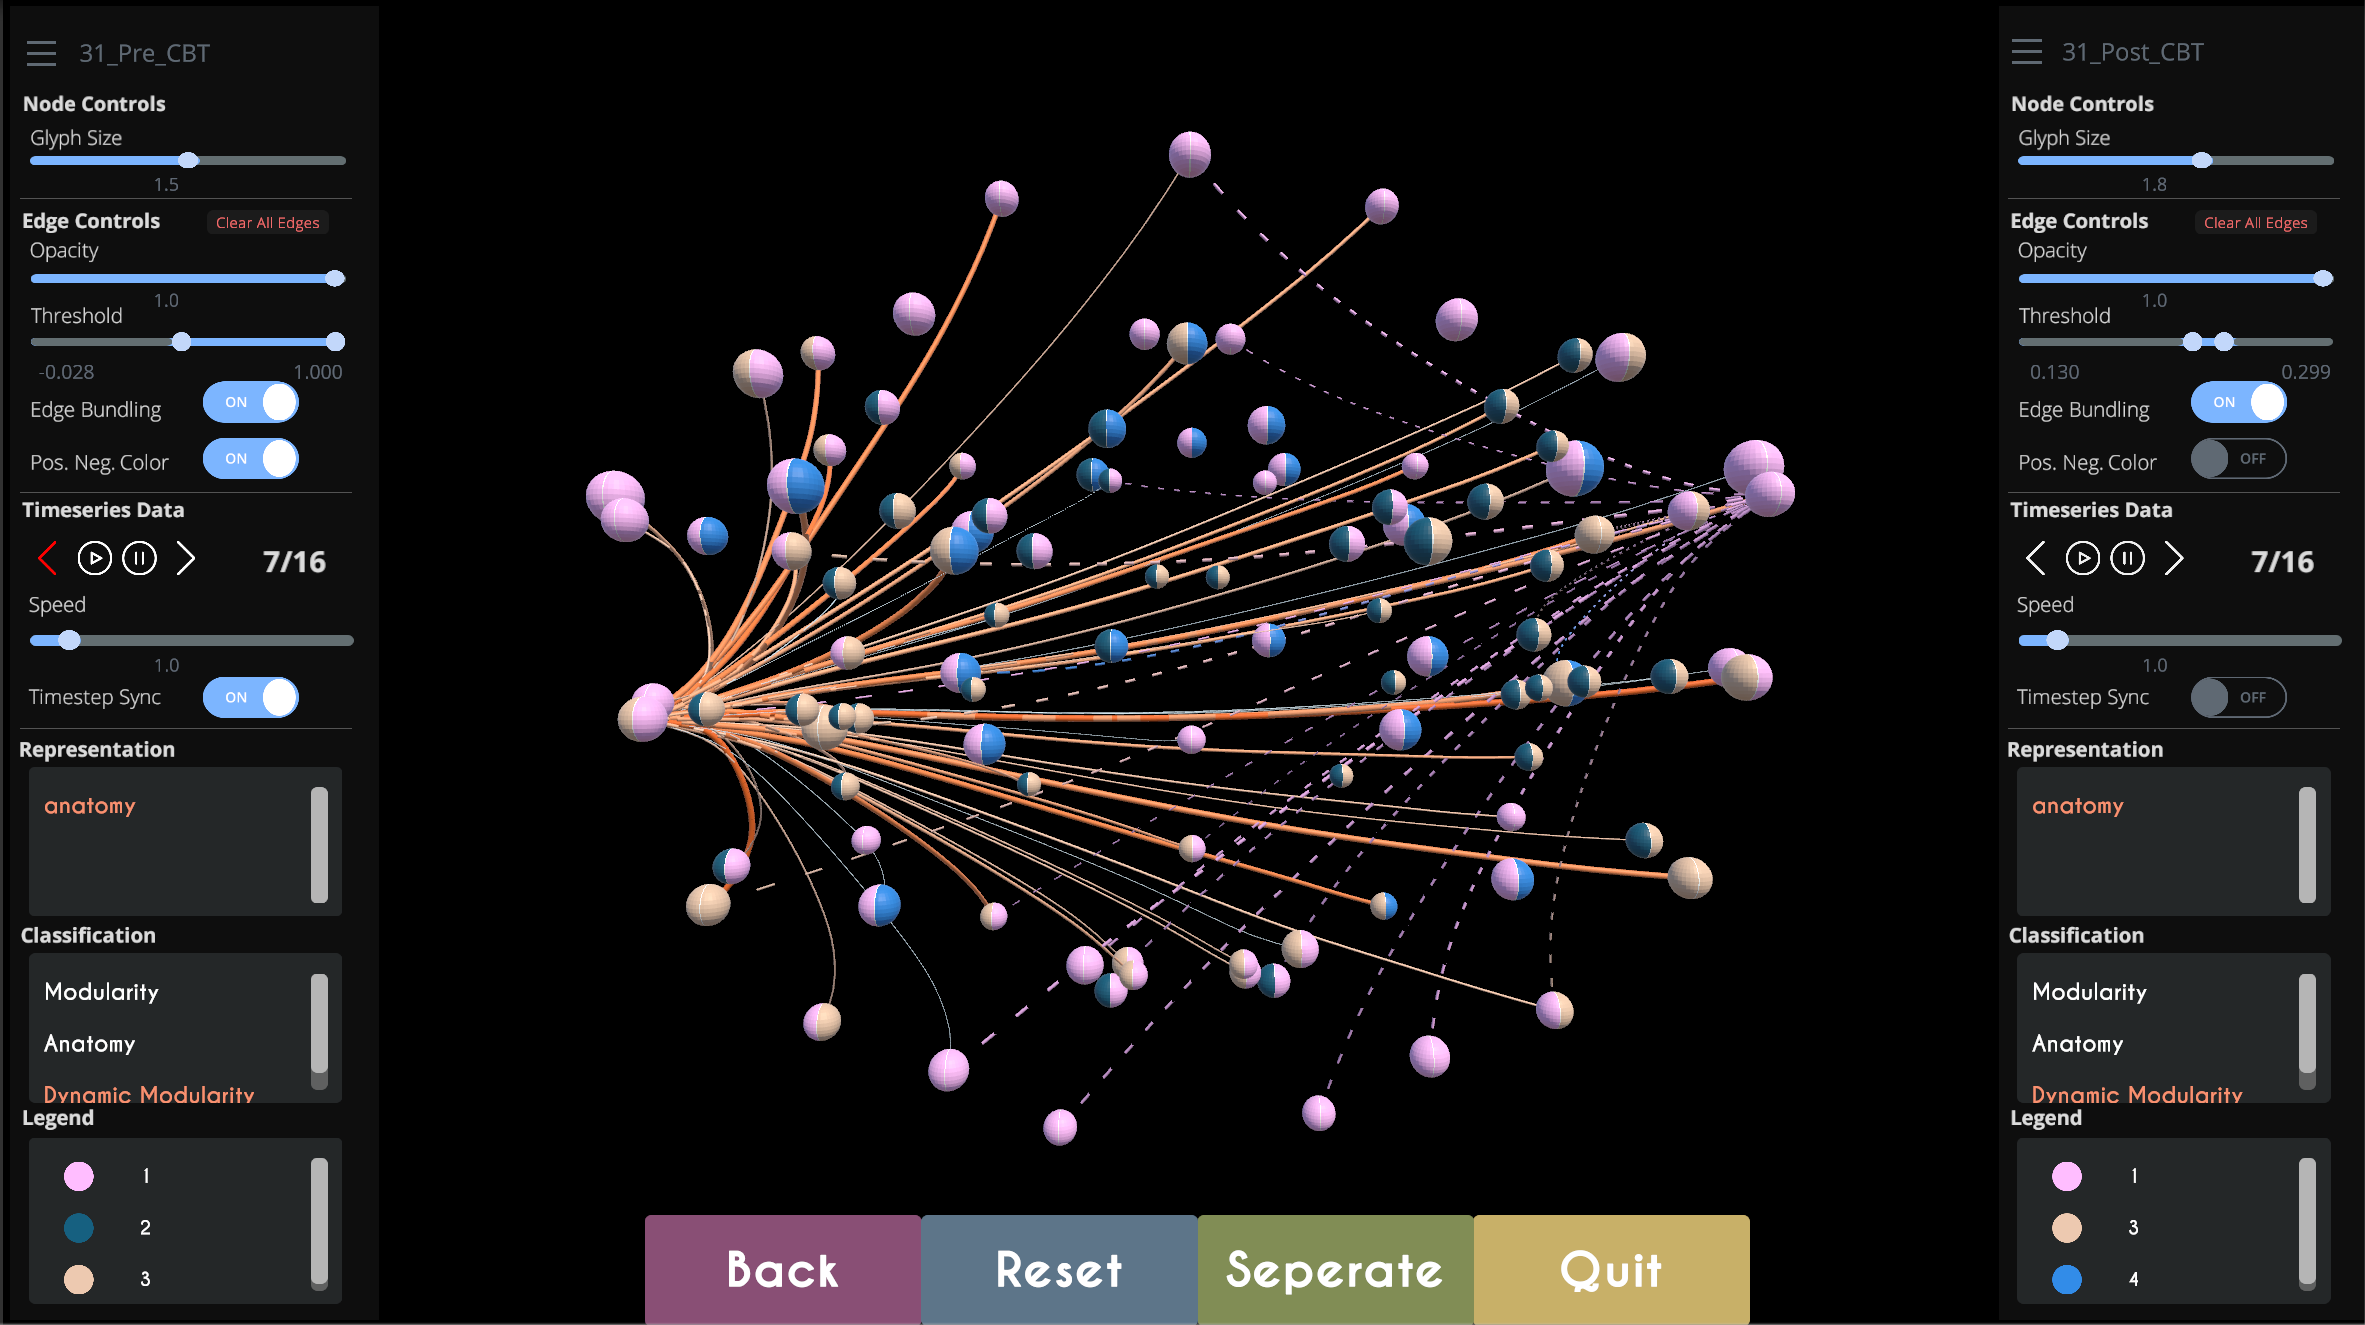
TempoCave is a novel visualization application for analyzing dynamic brain networks, or connectomes. The application provides a range of functionality to explore metrics related to the activity patterns and modular affiliations of different regions in the brain. These patterns are calculated by processing raw data retrieved functional magnetic resonance imaging (fMRI) scans, which creates a network of weighted edges between each brain region, where the weight indicates how likely these regions are to activate synchronously. TempoCave supports the analysis needs of clinical psychologists, who examine these modular affiliations and weighted edges and their temporal dynamics, utilizing them to understand relationships between neurological disorders and brain activity, which could have significant impact on the way in which patients are diagnosed and treated. TempoCave was developed in collaboration with with Olusola Ajilore and Alex Leow of the Collaborative Neuroimaging Environment for Connectomics at University of Illinois at Chicago, and was presented by first author Ran Xu at IEEE VIS in October 2019.

RuleVis is a web-based application for defining and editing “correct-by-construction” executable rules that model bio-chemical functionality, which can be used to simulate the behavior of protein-protein interaction networks and other complex systems. Rule-based models involve emergent effects based on interactions between rules, which can vary considerably with regard to the scale of a model, requiring the user to inspect and edit individual rules. RuleVis bridges the graph rewriting and systems biology research communities by providing an external visual representation of salient patterns that can be used to determine the appropriate level of detail for a particular modeling context. RuleVis was developed in collaboration with the Fontana Lab at Harvard Medical School. An article describing the project was presented at IEEE VIS in October 2019.
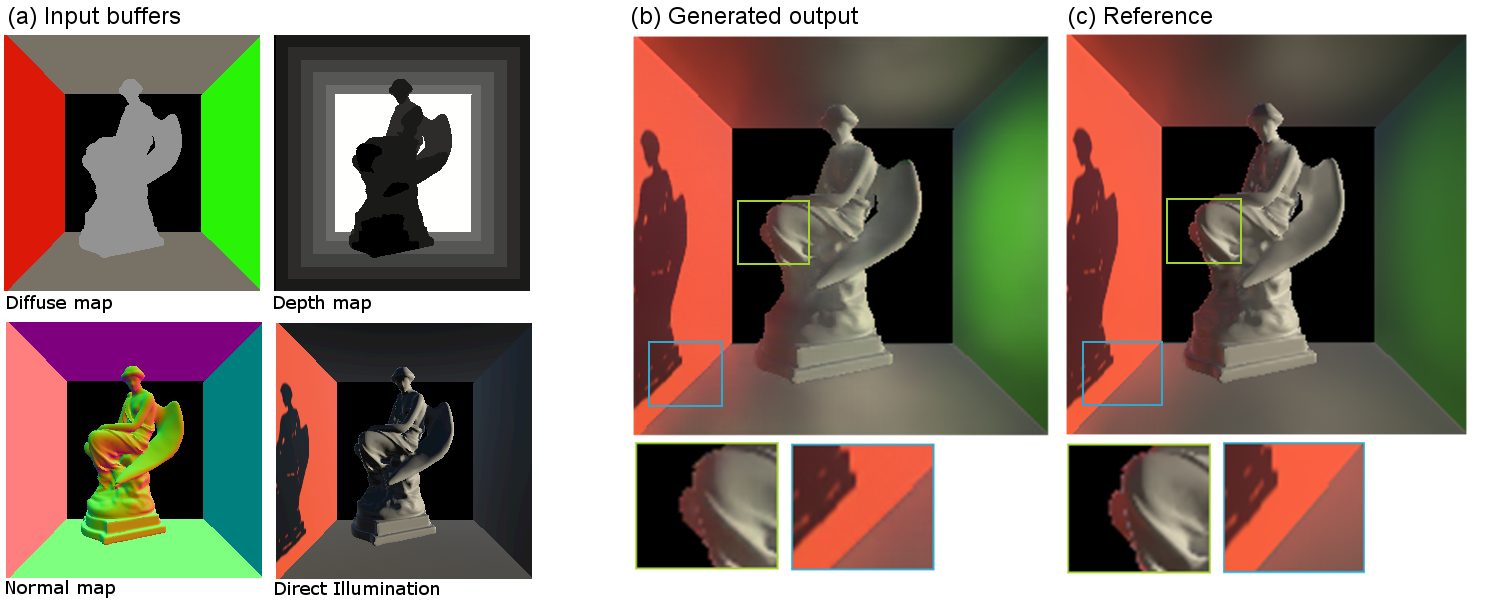
Deep Illumination is
a novel machine learning technique for approximating global illumination (GI) in real-time applications using a Conditional Generative Adversarial Network that can generate indirect illumination and soft shadows with offline rendering quality at interactive rates. Inspired from recent advancement in image-to-image translation problems using deep generative convolutional networks, we introduce a variant of this network that learns a mapping from G-buffers (depth map, normal map, and diffuse map) and direct illumination to any global illumination solution. That is, we show that a generative model can be used to learn a density estimation from screen space buffers to an advanced illumination model for a 3D environment. Once trained, our network can approximate global illumination for scene configurations it has never encountered before within the environment it was trained on. We evaluate Deep Illumination through a comparison with both a state of the art real-time GI technique (VXGI) and an offline rendering GI technique (path tracing). We show that our method produces effective GI approximations and is also computationally cheaper than existing GI techniques. The paper describing the technique, authored by Manu Mathew Thomas and Angus Forbes and titled “Deep Illumination: Approximating Dynamic Global Illumination with Generative Adversarial Networks,” is available on arXiv.
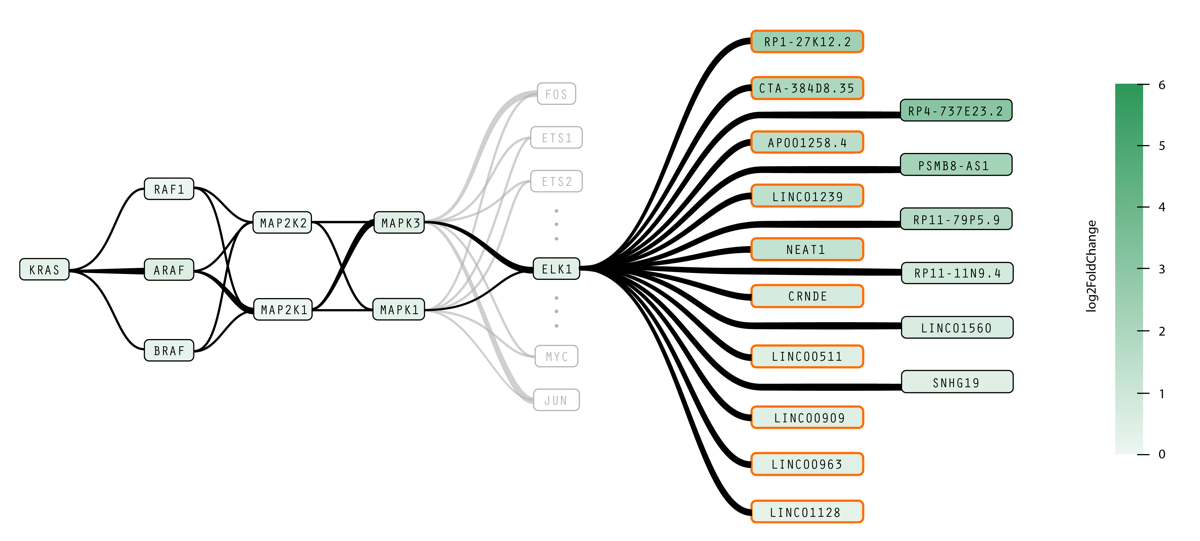
Static biological pathway diagrams represent biochemical relationships between particular biomolecular elements within a cell. Our cancer biology collaborators— Daniel Kim, Roman Reggiardo, and Haley Halasz of the Daniel Kim Lab at UC Santa Cruz’s Genomics Institute— conduct research into noncoding RNA “dark matter” in pluripotent stem cells and cancer, informing RNA-based precision medicine approaches to detect and treat cancer early on. We developed new visual representations of pathways to make it easier to investigate how mutations in the RAS protein family affect noncoding RNAs and to show causal relationships between transcription events and interferon simulated genes, which may provide deeper insight in to the mechanics of RAS-related cancers. These design experiments, titled RasVis, won a Best Poster award at the IEEE VIS BioVis Challenges Workshop, presented by Cassia Artanegara in October 2019.

Trees are one of the most fundamental data types. However, existing tree layout techniques are not always adequate for many real-world datasets. In addition to facilitating reasoning about hierarchical relationships, many application domains require the presentation of non-hierarchical relations between data items. For example, in the domain of molelcular biology, researchers analyze intracellular signaling pathways that can be composed of deeply nested sets of biomolecules (i.e., proteins and protein complexes). When displaying signaling pathways it is also important to clearly show how particular biomolecules influence or are influenced by others. That is, it may be necessary to highlight relevant interconnections between trees or subtrees while at the same time making sure not to obscure the hierarchical information in the tree. Similarly, in the domain of biodiverstiy informatics, the hierarchical structure of a phylogenic tree can usefully be overlaid with additional information that connects nodes in the tree in order to show, for instance, properties of a food web. Many other examples can be found in real-world datasets. The CactusTree layout, developed by Tuan Dang in collaboration with Angus Forbes, is a novel visualization technique that supports pattern recognition and the identification of connections over hierarchical datasets. Source code can be found at the UCSC Creative Coding code repository.

There are many challenges involved in creating meaningful augmented reality (AR) narratives. Interfaces for facilitating these AR experiences lack important functionality due both to technical challenges and to the difficulty of understanding ahead of time how users will respond to the various components that make up the experience. We are currently exploring effective abstractions of heterogeneous data in order to enable an appropriate spatial definition of content that can be used, for example, to effectively position virtual objects within the real-world and to clearly understand how users are behaving within an AR experience.
CAVE-AR is a novel system for facilitating the design of complex AR experiences and monitoring and communicating with users taking part in the experience. Both aspects of this system rely on the use of a virtual reality (VR) interface whereby a designer is able to remotely view and interact with all aspects of the AR experience, including 3D models of architecture, maps of the environment, live camera views, and rich sensor data from each participating player. Our system enables a designer to see what players are seeing, leading to new ways to interact with the players in real-time and to monitor and modify their experience. CAVE-AR has been used to design a novel AR scavenger hunt game, Digital Quest, and the Chicago history AR experience Riverwalk.
Understanding complicated networks of interactions and chemical components is essential to solving contemporary problems in modern biology, especially in domains such as cancer and systems research. In these domains, biological pathway data is used to represent chains of interactions that occur within a given biological process. Visual representations can help researchers understand, interact with, and reason about these complex pathways in a number of ways. At the same time, these datasets offer unique challenges for visualization, due to their complexity and heterogeneity.
We introduce a taxonomy of tasks that are regularly performed by researchers who work with biological pathway data. The generation of these tasks was done in conjunction with interviews with several domain experts in biology. These tasks require further classification than is provided by existing taxonomies. We also examine existing visualization techniques that support each task, and we discuss gaps in the existing visualization space revealed by our taxonomy.
Our taxonomy is designed to support the development and design of future biological pathway visualization applications. This work, developed by Paul Murray, Fintan McGee, and Angus Forbes was presented at BioVis’16 and published in BMC Bioinformatics.

TimeArcs is a novel visualization technique for representing dynamic relationships between entities in a temporal network. In many application domains, relationships between entities are not temporally stable, meaning that cluster structures and cluster memberships may vary across time. Our technique provides a big picture overview of the most significant clusters over time. It also supports a range of interactive features, such as allowing users to drill-down in order to see details about particular clusters. We have explored the utility of TimeArcs through its application to various datasets, including collocated popular phrases obtained from political blogs, the IMDB co-star network, and a dataset showing conflicting evidences within biomedical literature of protein interactions. This technique, developed by Tuan Dang in collaboration with Nick Pendar and Angus Forbes, was presented at EuroVis’16. Source code and video documentation can be found at the Creative Coding Research Group code repository.

Halos in a dark sky visualizes dark matter halo merger trees and their evolution through space and time. The prototype web application enables users to interact with individual halos within these trees in order to perform a range of visual analysis tasks, including: identifying the substructure and superstructure of the halos; observing the movement of halos across a custom range of time steps; and comparing the branching attributes of multiple trees. Central to our application is the ability to navigate the halos by interactively “jumping” from tree to tree. By clearly marking halos that have “tributaries” — that is, that split off into multiple halos or merge with one or more halos — the user can traverse the complex structure of the universe. The application is publicly available online and runs at interactive rates on the browser using hardware-accelerated graphics. Halos in a dark sky, developed by Kyle Almryde and Angus Forbes, took 2nd place in the 2015 IEEE SciVis Contest, “Visualizing the Universe”.
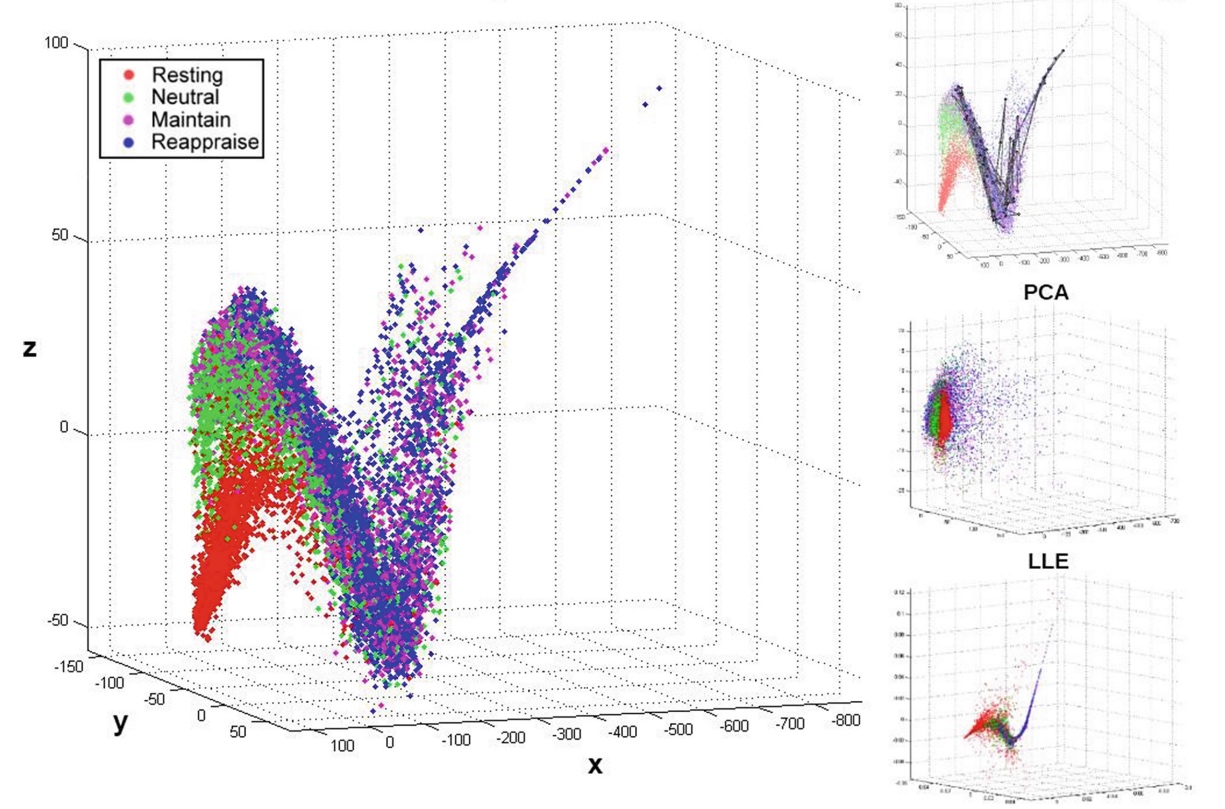
Assuming that the topological space containing all possible brain states forms a very high-dimensional manifold, this paper proposes an unsupervised manifold learning framework to reconstruct and visualize this manifold using EEG brain connectivity data acquired from a group of healthy volunteers.
Once this manifold is constructed, the temporal sequence of an individual’s EEG activities can then be represented as a trajectory or thought chart in this space. Our framework first applied graph dissimilarity space embedding to the temporal EEG connectomes of 20 healthy volunteers, both at rest and during an emotion regulation task (ERT), followed by local neighborhood reconstruction then nonlinear dimensionality reduction (NDR) in order to reconstruct and embed the learned manifold in a lower-dimensional Euclidean space. We showed that resting and ERT thought charts represent distinct trajectories, and that the manifold resembles dynamical systems on the torus. Additionally, new trajectories can be inserted on-line via out-of-sample embedding, thus providing a novel data-driven framework for classifying brain states, with potential applications in neurofeedback via real-time thought chart visualization.
Thought Chart was developed by Mengqi Xing and members of the Collaborative Neuroimaging Environment for Connectomics (CoNECt@UIC), and won a best paper award at BIH’16.

Real world group-to-group collaboration often occurs between partially distributed interdisciplinary teams, with each discipline working in a unique environment suited for its needs. Groupware must be flexible so that it can be incorporated into a variety of workspaces in order to successfully facilitate this type of mixed presence collaboration. This project introduces new techniques for sharing and synchronizing multi-user applications between heterogeneous large-scale shared displays. The first partitions displays into a perfectly mirrored public space and a local private space. The second enables user-controlled partial synchronization, where different attributes of an application can be synchronized or controlled independently. This work, led by Thomas Marrinan in collaboration with Jason Leigh, Luc Renambot, Angus Forbes, Steve Jones, and Andrew Johnson, was presented at ISS’16 and CSCW’17.
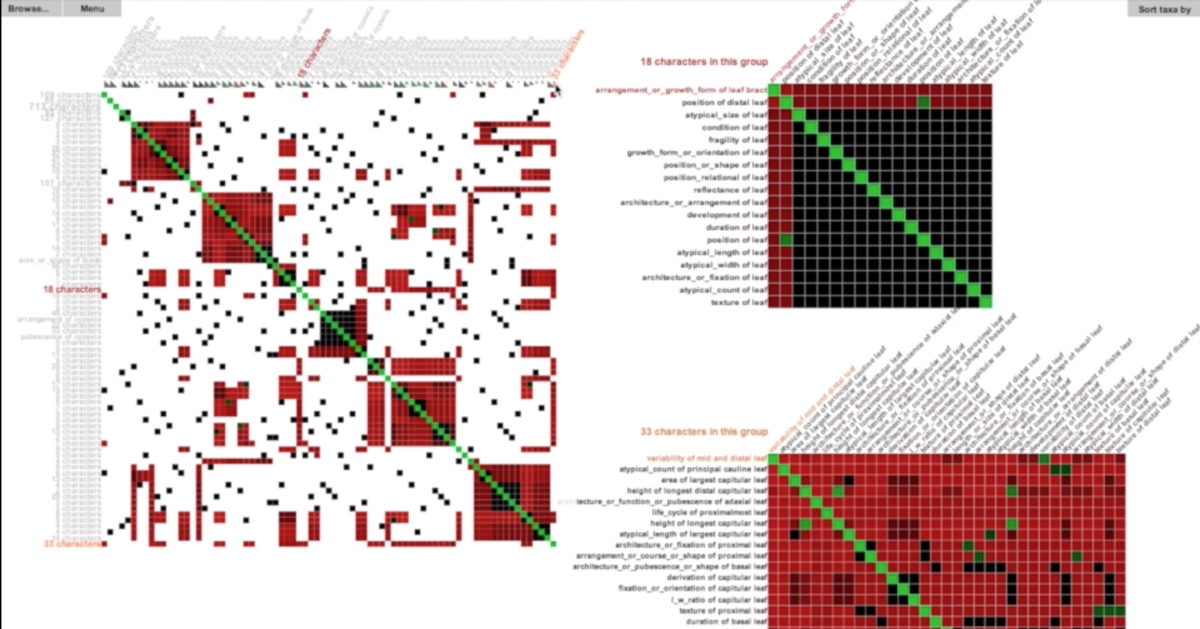
Taxon-character matrices are one of the primary tools that biologists use to classify organisms and to study evolution. Although traditionally created by hand, newer software tools make it possible to create matrices much larger than a manual workflow could support. The size of these matrices demands novel visualization techniques that are scalable and that support the curation, management, and exploration of large taxon-character matrices and their derivatives (e.g. character-character matrices). An obvious way to visualize character-by-character similarity is by using an adjacency matrix where the color in each cell encodes the similarity of each pair of characters. However, this approach does not scale well due to the size constraints of a typical computer screen.
To mitigate this scalability issue, we can provide a high-level abstraction of the original matrix. Rather than drawing every single cell, we hide certain fine-grained details of the original matrix at higher levels while still enabling a user to interactive view these details on demand. MultiLayerMatrix is a new scalable technique to visualize very large matrices by breaking them into multiple layers. The top layer shows the relationships between different groups of clustered data while each sub-layer shows the relationships between nodes in each group as needed. This process can be applied iteratively to create multiple sub-layers for very large datasets. MultiLayerMatrix, developed by Tuan Dang in collaboration with Hong Cui and Angus Forbes, was presented at EuroVA’16. Source code can be found at the Creative Coding Research Group’s code repository.
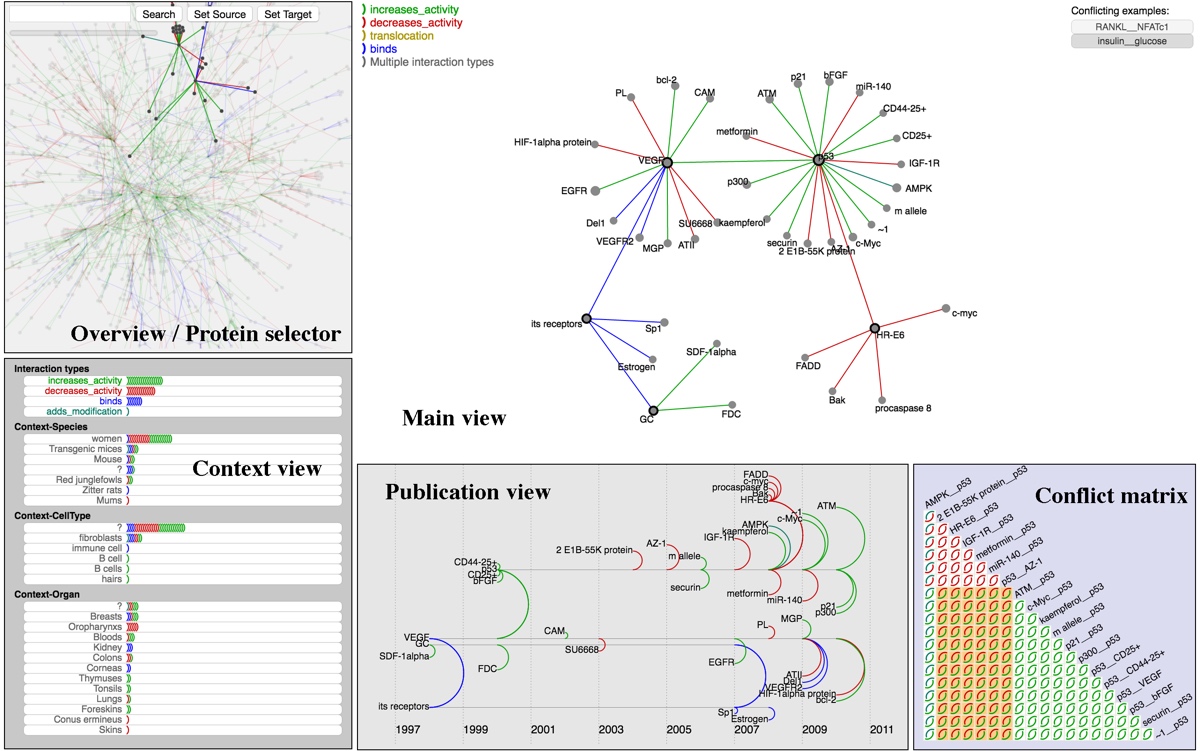
BioLinker facilitates the bottom-up exploration of protein interaction networks. A user can initiate an exploration from a small subnetwork that connected to a particular protein of interest and then iteratively expand the network on demand by choosing individual elements to expand. BioLinker provides multiple views that each display a different aspect of the currently selected subnetwork, such as the contexts of the protein interactions, the publication data related to the discovery of these protein interactions, and conflicts between different interpretations of experiments found in the publications. Each of these integrated views provide important supplementary information through brushing and linking. The BioLinker database currently contains over 3.5 million protein interactions extracted from approximately 290,000 publications and is accessible via our API, located at http://ccrg-data.evl.uic.edu/index-cards/explorer and source code is available at the Creative Coding Research Group code repository.

BRAINtrinsic is a novel VR-compatible visualization application that enables users to interactively explore the human brain connectome and its intrinsic topology. It enables a user to reconstruct and analyze the intrinsic geometry of brain data, that is, the topological space where the brain connectivity natively resides (independent of neuroanatomy). The utility of this intrinsic geometry could lead to a greater distinction of differences not only in clinical cohorts, but possibly in the future to monitor longitudinal changes in individual brains in order to better deliver precision medicine. BRAINtrinsic was developed by Giorgio Conte in collaboration with Angus Forbes, Alex Leow, Allen Ye, Olusola Ajilore, and others affilated with the Collaborative Neuroimaging Environment for Connectomics (CoNECt@UIC). It was presented at BIH’15 and has been utilized for research appearing in Brain Informatics and Human Brain Mapping.
The density of points within multidimensional clusters can impact the effective representation of distances and grouping when projecting data from higher dimensions onto a lower dimensional space. This collaboration from Ronak Etemadpour and Angus Forbes examines the use of motion to retain an accurate representation of the point density of clusters that might otherwise be lost when a multidimensional dataset is projected into a 2D space. We study how users interpret motion in 2D scatterplots and investigate whether or not they are able to effectively interpret the point density of the clusters through motion. Specifically, we consider different types of density-based motion, where the magnitude of the motion is directly related to the density of the clusters. This research was developed by Ronak Etemadpour and Angus Forbes, and first presented at BigData’14 and VDA’15, and then published in the Information Visualization journal.

BranchingSets is a novel interactive visualization technique for augmenting node-link diagrams with information about the categories that both nodes and links belong to. Our technique enables user-driven methods to procedurally navigate the graph topology as well as to interactively inspect complex, hierarchical data associated with individual nodes. Developed by Francesco Paduano in collaboration with Angus Forbes, BranchingSets has been applied to biological pathway networks as well as co-authorship networks. The biology pathway network use case was presented at BioVis’15 in Dublin, Ireland, and an evaluation of the technique was presented at VINCI’16 in Dallas, Texas.

PathwayMatrix is a visualization tool that presents the binary relations between
proteins in the pathway via the use of an interactive adjacency matrix. We provide filtering, lensing, clustering, and brushing and linking capabilities in order to present relevant details about proteins within a pathway network, enabling systems biologists and cancer researchers to find patterns in the relationships and reactions between proteins and protein complexes. PathwayMatrix, developed by Tuan Dang in collaboration with Angus Forbes and Paul Murray, was presented at BioVis’15; source code can be found at the Creative Coding Research Group code repository.
Passive wayfinding devices, such as signs, maps, schedules and arrival time displays are essential parts of most successful, modern public transit networks. In contrast with contemporary transit navigation software, passive wayfinding devices accept no input but, rather, instead provide the user with the information needed to make their own way to their destination. In this paper, we describe a new type of passive wayfinding device: a fully enriched animated, ambient display. Our design makes use of a novel animation strategy to aid travelers in route planning tasks. To provide an initial validation of our design choices, we have conducted a pilot study that assesses a usage scenario demonstrating how our visualization can be used to facilitate effective urban wayfinding in the City of Chicago and elsewhere. The prototype application, TransitTrace, was developed by Massimo De Marchi in collaboration with Jakob Eriksson and Angus Forbes and presented at ACM SIGSPATIAL’15.
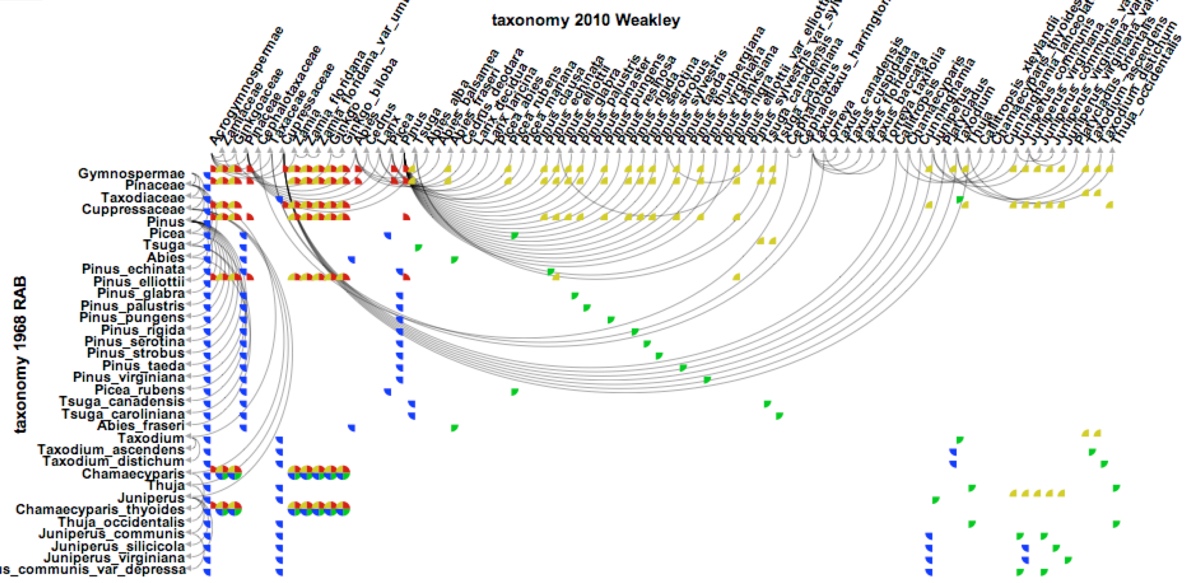
Visualizing and analyzing the relationships between taxonomic entities
represented in multiple input classifications is both challenging and required
due to recurrent new discoveries and inferences of taxa and their phylogenetic
relationships. Despite the availability of numerous visualization techniques, the
large size of hierarchical classifications and complex relations between taxonomic
entities generated during a multi-taxonomy alignment process requires
new visualizations. ProvenanceMatrix is a novel tool allowing
end users (taxonomists, ecologists, phylogeneticists) to explore and comprehend
the outcomes of taxonomic alignments. ProvenanceMatrix, developed by Tuan Dang in collaboration with Nico Franz, Bertram Ludascher, and Angus Forbes, has been evaluated on taxonomic classifications of various sizes, from a
few to hundreds of taxonomic entities and hundreds of thousands of relationships. It was presented at VOILA’15, the ISWC Workshop on Visualizations and User Interfaces for Ontologies and Linked Data.

Signal alteration is a well established means for artistic expression in the visual arts.
A series of collaborations by Javier Villegas and Angus Forbes explore a range of interactive projects featuring novel video processing techniques on mobile and desktop environments.
We introduce a powerful strategy for the
manipulation of video signals that combines the processes
of analysis and synthesis. After an analysis process a signal
is represented by a series of elements or features. This
representation can be more appropriate than the original
for a wide range of applications, including, for example, the
compression and transmission of video signals, or this representation can be used
to generate new modified instances of the starting signal. Our Analysis/Synthesis (A/S) approach is general enough to
be adequate for the creation of non-photorealistic representations
that are not intended to mimic art styles from the
past, but instead seek to find novel creative renditions of
moving images.
Our methods are particularly powerful in interactive arts projects as they enable even drastic manipulations of the input image while still maintaining fundamental aspects of its original identity.
Articles describing the theory, application, and evaluation of these A/S techniques have been presented at ACM MM’14, VPQM’14, and HVEI’15.
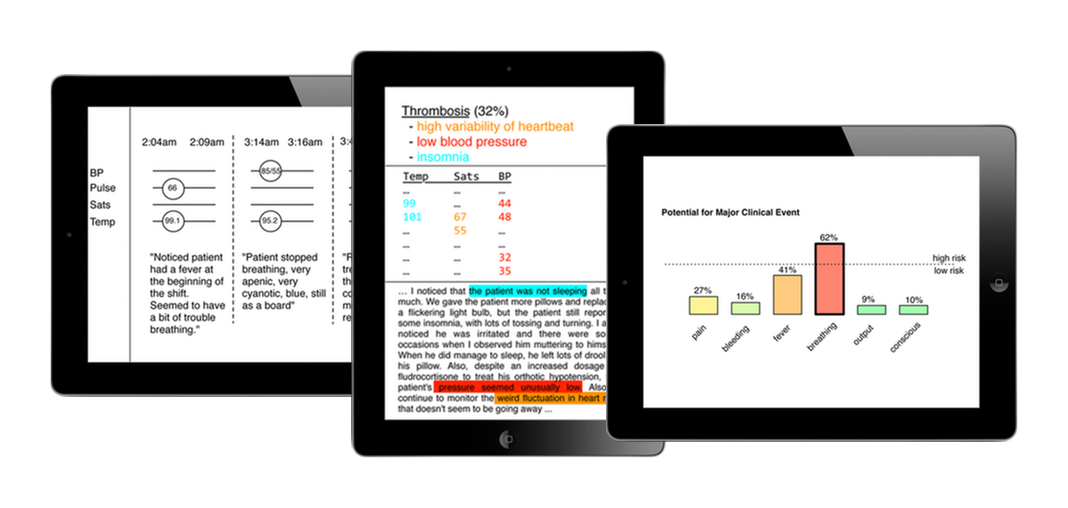
The use of electronic health records (EHRs) in clinical environments provides new opportunities for clinicians to integrate data analyses into their practice. While having access to these records has many benefits, the act of recording, retrieving, and analyzing this data can nonetheless introduce communication issues, as navigating and interpreting large amounts of heterogeneous data can be difficult, and conclusions can be hard to validate. In collaboration with Jane Carrington and Mihai Surdeanu from the University of Arizona, Angus Forbes created a series of integrated visual interfaces to help nurses document and reason about patient data and about clinicians’ understanding of patient data. The interfaces present the output of a predictive algorithm that makes use of historical EHR data, patient vital signs, and nurse handoff reports in order to classify a patient in terms of their likelihood of experiencing clinical events. Furthermore, the interfaces enable the nurses to quickly explore the original data and to examine other nurses’ interpretation of patient activity during previous shifts. This work, funded by the National Institutes of Health as part of the NSF/NIH Smart and Connected Health Program, has been presented at TextVis’13, and an implementation developed by Alessandro Chetta and Angus Forbes was introduced at VAHC’15, and is currently being evaluated in the context of real-world healthcare situations.
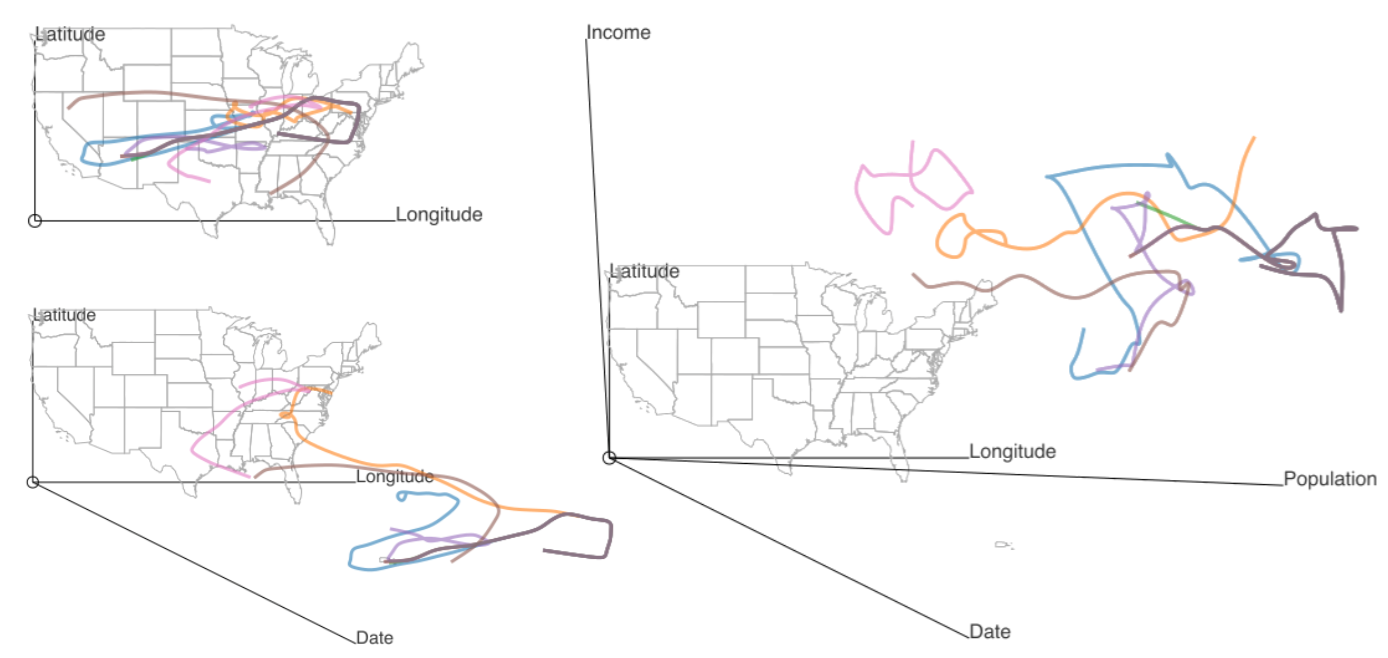
Stretch projections allow users to interactively interrogate multivariate datasets in real-time by “stretching” data into data onto a two-dimensional display. The position of each element is based on a linear combination of variables determined by the analyst. The technique is particularly relevant to geotemporal data, where geography and time interact with a number of other variables. A protoype application, Stretch Plot, was used to visually explore a large dataset related to traveling musicians. Data include the date and geographic location of performances given by over 3000 musicians over the span of four years. In addition, social and demographic data – such as median household income and racial distributions – was collected based on the geographic coordinates of each performance location. The technique was created by Paul Murray in collaboration with Angus Forbes and the StretchPlot application was presented at VAST’14 and MapInteract’14.

This collaboration with Saiph Savage and Tobias Höllerer presents a system that automatically classifies social network data in order to support
a user’s directed social queries and, furthermore, that allows the user to quickly verify the accuracy of the classifications. We model a user’s friends’ interests in particular topics through the creation of a crowd-sourced knowledge base comprised of terms related to user-specified semantic categories. Using this model, our system makes it possible to quickly identify friends who have a high probability of being able to answer particular questions or of having a shared interested in particular topics. This work was presented at TextVis’12.

The Natural materials browser is a tablet application created in collaboration with the materials scientist Tony Fast.
The application enables a user to interact with volumetric datasets created from a series of natural materials samples.
The data samples— high resolution meso-scale volumetric images of nutshells gathered via micro-computed tomography— are envisioned as “virtual specimens” presented many orders of magnitude larger than their characteristic length scale. The user, initially placed in the center of the volumetric dataset and facing orthogonally toward the original 2D image slices, uses a tablet as a magic lens to view and navigate the data via physical rotation and multitouch gestures. The user has simultaneous access to multiple representations of the datasets from any angle or position, and an additional viewport provides real-time, spatial statistics on the current view of the currently loaded dataset. The Natural materials browser was first presented at IEEE VIS in 2013.

Tag River is a visualization that presents a detailed comparative overview between mutiple users’ content within a particular time period;
and providing a trend summarization over a range of time spans. The summarization is displayed using
vertically-adjacent polygonal regions in which the area represents some facet of quantitative information. A series of animated tag
clouds are used to provide more detailed content for each user, changing over time to provide an indication of the coherence
of context between time segments. The concurrent representation of both multivariate and temporal data can be cycled though programmatically or navigated interactively. Tag river is a collaboration with Basak Alper and Tobias Höllerer and was presented at TextVis’11.